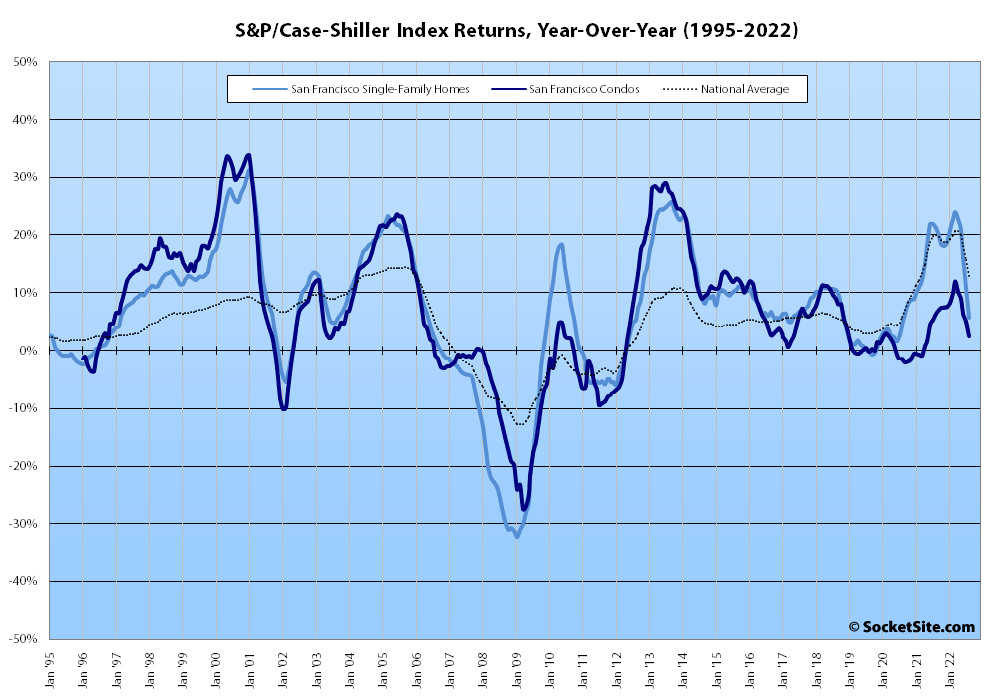
Having dropped 3.5 percent in July, the S&P CoreLogic Case-Shiller Index for single-family home values within the San Francisco Metropolitan Area – which includes the East Bay, North Bay and Peninsula – fell another 4.3 percent in August, which was the largest month-over-month decline for the index since February of 2008. And while the index is still 5.6 percent higher than at the same time last year, it’s down 8.9 percent since May alone, has rapidly decelerated from a 24.1 percent year-over-year increase in March, and is poised to soon demonstrate a year-over-year decline in values, as we outlined last month and none of which should catch any plugged-in readers by surprise.
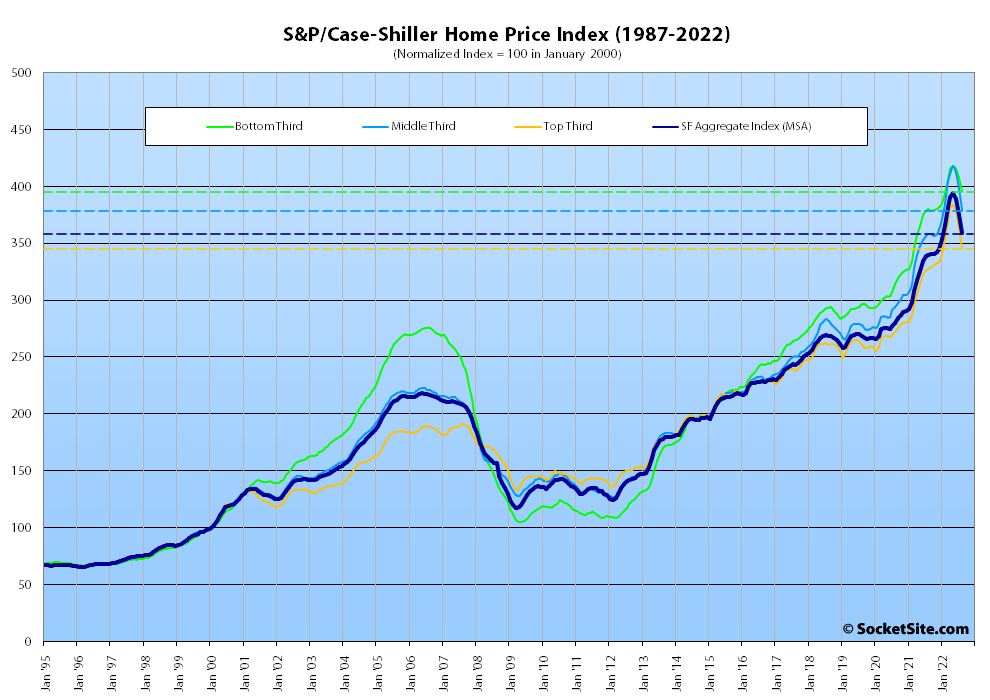
At a more granular level, the index for the least expensive third of the Bay Area market dropped 2.8 percent in August for a year-over-year gain of 4.2 percent; the index for the middle tier of the market dropped 4.6 percent for a year-over-year gain of 5.9 percent; and the index for the top third of the market dropped 4.7 percent in August, and is down 10.0 percent since May, for a year-over-year gain of 5.5 percent, down from 25.1 percent in March.
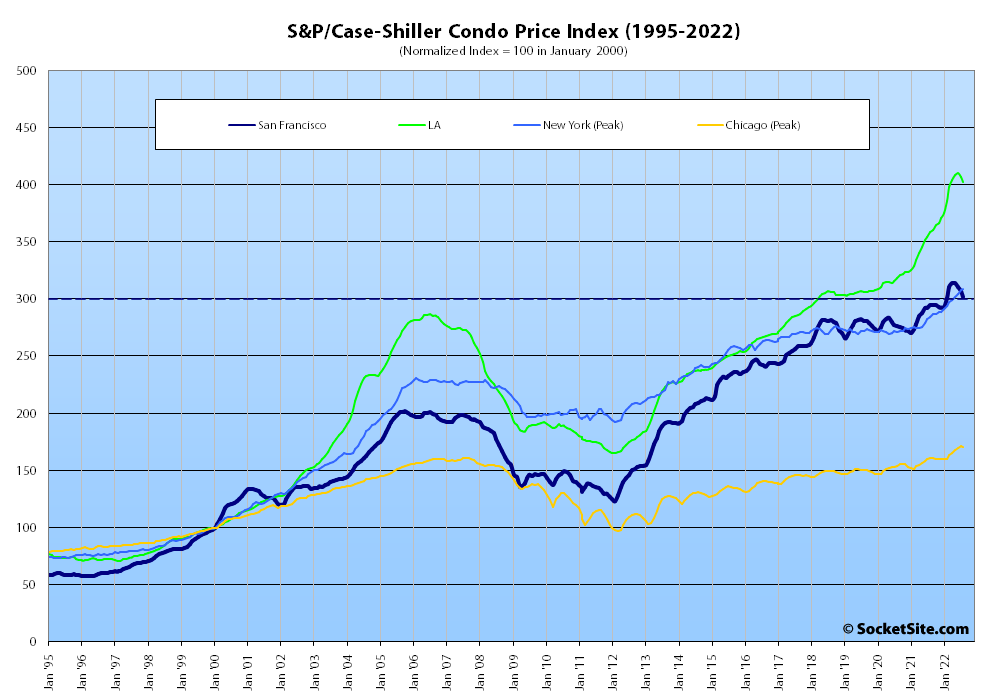
The index for Bay Area condo values, which remains a leading indicator for the market as a whole, dropped another 1.7 percent in August for a year-over-year gain of 2.5 percent, which was down from a localized peak of 12.0 percent in March and versus year-over-year gains of 12.1 percent, 6.3 percent and 8.6 percent in Los Angeles, Chicago and New York respectively.
Nationally, Miami led the way with respect to exuberantly indexed home price gains, up 28.6 percent on a year-over-year basis, followed by Tampa (up 28.0 percent) and Charlotte (up 21.3 percent) but with an acceleration in the “deceleration in U.S. housing prices,” a month-over-month drop of 1.1 percent overall, and the index for San Francisco having dropped more than any other major metropolitan area.
Our standard SocketSite S&P/Case-Shiller footnote: The S&P/Case-Shiller home price indices include San Francisco, San Mateo, Marin, Contra Costa and Alameda in the “San Francisco” index (i.e., greater MSA) and are imperfect in factoring out changes in property values due to improvements versus appreciation (although they try their best).
Just imagine if houses were selling. Prices would be down more like 10-20% but since nobody’s buying…
Wait until we see the September data: post interest rate super spike.
Go for the 5 year ARM. Housing is too big to fail. Housing never goes down in price long term.
Actually, I can see the boomer slogans now, pasted on their sweaters via colorful stickers: “Owners Vote! Renters Don’t !”
In the long term, this drop is a correction, much like the stock market. Prudent financial advisors are telling people to hold tight, that history repeatedly shows that corrections and even recessions are normal economic phenonmena. While individual houses and certainly condos may fall and take a long time to recover, the overall property market will come back, just as it did after 2008, and 1987, and many other times. This is not going to be another Great Depression. The sky is not falling.
I haven’t seen or heard anyone speculate that this is the next Great Depression, or that the sky is falling. Have you?
That said, the Bay Area runs on VC pixie dust, and we’re falling a bit short these days:
Q3 2022 VC Funding by City – Bay Area: $11.8 billion, down from $22.1 billion in Q2
So we’re only halfway to paradise?? (534/1000ths to be more precise) You’ll need to do a whole lot
betterworse than that to make window ledges a “go to” spot.Shares of Silicon Valley Bank are down about 64% YTD. Wells Fargo shares are down about 9% over the same period.
Other interesting take-aways from that article are that NYC, Boston, and Seattle saw similar percentage declines as the Bay Area. Also, the amount of VC funding in Austin is tiny, the smallest of the areas noted in the article.
VC Pixie dust only, eh? The monetization of the Internet, a sizeable portion of the world’s computing, and that corresponding infrastructure not so much? Disagree.
Which brings us back to the fact that the Case-Shiller Index for single-family home values within the San Francisco Metropolitan Area has dropped 8.9 percent since May alone and is currently depreciating faster than any other major metropolitan area and at a faster rate than in 2008 as well, despite all that monetization, computing power and infrastructure in hand…
So the Bay does run on VC pixie dust and she’s a runnin’ out. Tinker Bell is not coming down that runway anytime soon, buckaroos. Got it. Thanks for clarifying.
“still 5.6 percent higher than at the same time last year” – not too bad given that the markets have been hammered and mortgage rates are up a lot. Bay Area is still an economic phenom. Home prices went nuts and will fall short term. If I were in the market to buy I’d wait. If you bought in the last 2-3 years and have no choice but to sell, you’ll take a hit. Everyone else, mostly sitting on fixed mortgage rates under 3 or 4% (mine is 2.3%), no real problems.
“still 5.6 percent higher than at the same time last year,” but “down 8.9 percent since May” and “poised to soon demonstrate a year-over-year decline,” likely within a month or two and with mortgage rates having increased by another full percentage point since the August numbers were compiled.
In addition, the phenom-enal 5.6 percent year-over-year gain in August was not only the weakest of the 20 largest MSAs but less than half a national average of 13 percent.
While there has been a large drop off in funding for Bay Area startups, the value of third-quarter deals is still greater than that of the fourth quarter of 2019. For more context, Bay Area GDP is around $535 billion. Compare this to say, the Cleveland-Elyria metro area GDP of $114 billion.
Another thing to bear in mind: “The ability to make deals over Zoom has changed VC quite a bit. It was a major reason why the 2020 deal count boomed through the second half of the year and why 2021 deals occurred at a faster pace than ever before,” says PitchBook’s Stanford. “It’s now just as easy to invest in a company down the street as it is on the opposite coast.”
The US economy has survived a number of adverse events, including the Great Depression, and grown and thrived in the aftermath. But at a more granular level, many companies have failed, many industries have been destroyed or disrupted, many areas have been reduced to shells of their former selves.
Even close to home here in SF I often see older home with great looking bones in what are now less then desirable areas. Broad economic progress seems to always find a way to march on, but someone always bears the brunt of the “destruction” part of the markets creative destruction. The fate of the broader average is not the fate of individual data points.
What’s the point of including 25 years of data when you are talking about the trend over the last 10 or 11 months?
Context? Personally I’d want to see it going back 50 years since that was the last time we had this kind of interest rate onset combined with these record-low birth rates. Demographic and economic conditions right now have certain striking similarities to 1974.
The y-axis should be logarithmic to properly capture the effect of exponential growth/decline in (prices, indexes, etc). The linear scale is highly misleading to the eye.
So you’re saying the drop is more dramatic than shown?
Opposite. e.g, the recent drop is ~390 to ~360 … which is less percentage-wise than the drop from Jan ’01 to Jan ’02 (~135 to ~125), but looks much worse.
The Four Seasons Residences which opened for pre-sale in 2020 is struggling. Per the SFBT:
“One of the city’s most anticipated downtown luxury condo high-rises is sitting nearly empty more than a year and a half after opening.
Compass Development Marketing Group says only 13 of the 146 units at the Four Seasons Private Residences, 706 Mission St., have sold. City records show the last new deed dates to June 1, indicating that no sales closed there in the third quarter.”
One has to assume “deals” can be had on these brand-new “luxury” condos the longer the building sit virtually empty.
Less than 10% sold is far beyond pathetic, but what is the actual occupancy rate? 5%? 1%? 0%?
There are plenty more of these catastrophes up and down the Market St corridor and SOMA. What a cluster****. Who cudda seen dis coming?! Way to go market rate mobsters!
If you navigate over to their website, it acknowledges that units are available for purchase, but also says:
Emphasis mine.
I’m finding it difficult to care about this. Seems like the developer of the building wrung their money out of it and left someone else holding the bag. Redfin doesn’t seem to indicate that there are any units in the building available for sale.
That’s the adjacent Four Seasons Hotel and Residences at 765 Market Street to which you’re linking versus the new Four Seasons Private Residences at 706 Mission Street, the sales office for which is still wide open.
Thanks for the correction.
With the ridiculous HOA fees, these are viable only for the rich or for those who buy them to be re-let by the hotel (i.e., also the rich). Maybe OK if you’re enamored with labels and brands, but I go more for actual living experience and living “at the Ritz” is if anything a negative for me – even before having to weigh in the HOAs.
“these are viable only for the rich”
But I’ve been educated in these forums that the only way to make housing more affordable for all is to encourage developers to build what will earn them the maximum profits at any given moment. Surely, if we want affordable homes for working class families, we must continue to encourage developers to build many more vast, empty luxury condo towers for speculators, flippers, foreign capital flight, money launderers, Air BnB, and pieds a terre for the parents of disrupting pizza delivery app unicorn start up sinkholes.
God forbid housing was built to meet actual organic demand.
This project paid a big check to MOH to build what you are looking for
Offsite affordable housing = segregation. That check no doubt paid for more than a few bespoke lunches for lobbyists, mayoral cronies, and UCB real estate economists. I wouldn’t doubt the rest of the check bought an unremediable radioactive lot in BVHP for future real estate development chicanery. Forget it, Jake, it’s San Francisco.
Oh I’m not saying they don’t increase supply, yada yada. I’m just saying that at least one reason they might not have sold well is the ridiculous HOAs. Certainly having umpteen unsold units sitting out there does (presumably) depress the market a bit… unless, again, something something rich and can afford the carry costs for empty unsold units.
So if we stop building these kinds of towers for the rich, developers will just target smaller and mid-size buildings to renovate and force out existing tenants and you’ll just cry even harder about that.
How do you propose to force developers to build housing for “organic demand”?
For starters, reduce the cost of entry, i.e., the baseline minimum psf costs to build a unit in S.F. Absent coming out of pocket to subsidize the construction cost, you couldn’t build a $500,000 unit in S.F. no matter how much you wanted & no matter how much you somehow magically got neighborhood support.
Don’t get me wrong, I’m actually all for empty condos owned by foreign investors – that means transfer tax and property tax revenue for SF, with no demand for services (other than base-level fire fighting, I suppose…) but that doesn’t eliminate the need for actual housing for actual residents.
No force necessary. If non-organic “demand” were restricted — as done in many countries with democratic and egalitarian values not found in the US — land acquisition costs would be kept down and developers’ retail price points wouldn’t be based on bubble expectations. Without that ~30% speculator, flipper, foreign capital flight, money laundering, Air BnB, and pieds a terre cohort feeding a bubble, developers could buy land and build for resale for much less. Fewer used house salespersons would be driving Lexi, so there is that unfortunate downside..
“I’m actually all for empty condos owned by foreign investors – that means transfer tax and property tax revenue for SF, with no demand for services ”
That’s quite a civic model you got there. What do you call it?
“Without that ~30% speculator, flipper, foreign capital flight, money laundering, Air BnB, and pieds a terre cohort”
Is there statistical support for this 30% number?
“Economic Consequences of Housing Speculation” Gao, Sockin, Xiong. December 2018
This one looks back to the previous crack-up. I suspect that with the (figurative) explosion of STR and foreign capital flight during the twenty-teens, that the number could now be higher. The number of cash sales is a clue. There was a more recent study which I don’t have at hand, but the string match retrieval algorithm of your choice is your friend. I think I tried to link to one here a few months back, but the editor thinks my links stinks.😅
Is that 30% of all property sales in San Francisco? 30% of all residents of San Francisco?
I tracked down the paper you mentioned. It absolutely positively does not in any way support your claim at all even everything in it is correct.
It looks at non owner occupied purchases in New York, Las Vegas, and Charlotte. In 2005 the percentage in Vegas almost reached 30%. The US average peaked at 15%. The New York peak was 7%, or half the US average. In Vegas the proportion fell to about 20% within few years. The paper never even mentions San Francisco, much less analyze anything about it’s housing market. New York is the most similar to San Francisco, and this paper would indicate that San Francisco’s ratio of non-owner occupied purchases is well below the national average.
Do you have any actual statistical support for your 30% number?
The real estate industry itself acknowledges ~18% speculator cohort, as defined by business or institutional purchase (hellooooo Blackrock).
If you think individual speculators, flippers, short-term rentals, foreign capital flight, and second homes/pieds a terre, account for less than 12% of purchases in SF, I wanna hit off your weed.
“real estate industry” being redfin. Even if you think individual landlords, speculators, flippers, foreign capital high-flyers, money launderers, Air BnB hoteliers, and second-homies account for 0% of the market (go ahead, tell me they do), just that 18% institutional “investor” cohort is enough to radically skew illiquid, shelter qua asset market. Even a mere 10% would (and has and does) send the marginal price movements through the roof.
The two main causes of the insane real estate prices in the US are the significant percentage of non-organic buyers, and the hitherto low, low mortgage rates blowing sales prices through the roof while offering illusory low, low monthly payments. Without those two factors, you ain’t driving a Lexus, my friend.
2 beers, do you think a severe housing shortage has no impact on prices?
To answer your question which combines both strawman and red herring logical fallacies, as the see-through luxury towers discussed elsewhere on socketsite illustrate, there is no “sever housing shortage” in SF, only a shortage of affordable housing made unaffordable by economic, monetary, regulatory, and tax policies designed to turn shelter into risky speculative boom & bust get-rich-quick assets.
So the answer to my question “Do you have any actual statistical support for your 30% number?” is “No, I do not.”
“Single-Family Investor Activity Remained High in the Third Quarter [of 2021]” (corelogic)
I draw your attention to Figure 7: Highest Investor Shares by MSA, Q3 2021, San Francisco-Oakland-Hayward = 34.6%
The “investor” cohort in the study is defined as “those who retain one hundred or more properties.” So, the number reported in Fig 7 has to be much higher when accounting for smaller “investors.”
“The “investor” cohort in the study is defined as…”
That’s their definition of large investor. As when they break down investor purchases by investor size in Fig 3.
They define investor as:
“Using CoreLogic’s public records data, we define an investor as an entity (individual or corporate) who retained three or moreproperties simultaneously within the past 10 years or has a corporate or non-individual identifier on the deed. Examples include LLCs, CORPs, and INCs, to name a few”
I do not see the “speculator, flipper, foreign capital flight, money laundering, Air BnB, and pieds a terre cohort” category in that paper.
Definition of speculator: “A person who invests in stocks, property, or other ventures in the hope of making a profit.”
wilson- right, category conflation on my part, mea culpa, but how many non-organic buyers slip through their more-than-three-units-retained or business-identified criteria? We don’t know for sure, but it logically, obviously doesn’t capture all flips, second homes, foreign capital flight, short-term rentals, etc.
My point that the non-organic component must be even higher than 34.6% stands.
Here in San Mateo, homes are moving, but as one agent said to me, “it’s like a normal market outside of the Bay Area and CA.” Prices appear to be down about 10%. Typically 1 or 2 offers, and it can take 4 to 6 weeks. The usual rules apply, i.e. homes in better condition, with better floor plans move faster.
As the meme says: RETVRN to tradition! 60-90 days on the market used to be completely normal and expected. We can credit the internet with some of the market efficiency leading to declining days on market, but expecting to sell your house in 1-2 weeks is totally absurd and historically unprecedented.
The most recent median-days-on-market reading for SF is 21 days for Sep 2022, which is the same as it was in 2019 and lower than all years 2016 and prior. It’s still a crazy short amount of time. Of course, the usual caveats about how days-on-market is distorted still apply.
At the same time, pending home sales in San Francisco are down over 40 percent versus the same time last year; the average price per square foot of the homes which are in contract has slipped under its marks for 2021, 2020, 2019 and 2018 as well; and inventory in San Francisco is holding at an effective 12-year high with nearly 40 percent of the homes on the market having been reduced at least once.
Why the Pavlovian need to jump in whenever someone says even a nuanced positive take? It stands in stark contrast with the deafening editorial silence regarding 2021 being an all time high market.
Deafening (Index for Bay Area House Values Up 22.1 Percent YOY), absolutely (Index for Bay Area House Values Gained 18.8 Percent in 2021) deafening (Index for Bay Area House Values Up Nearly 23 Percent YOY).
Which brings us back to the index and trends at hand…
That wasn’t in response to what I wrote, one, and secondly a couple glances at the discussions under those links show you jumping in to do precisely what I asked about. Meanwhile, like four or five one trick ponies on here get to bloviate utter drivel daily with zero editorial pushback.
UPDATE: Index for Bay Area Home Values Has Dropped Nearly 12%