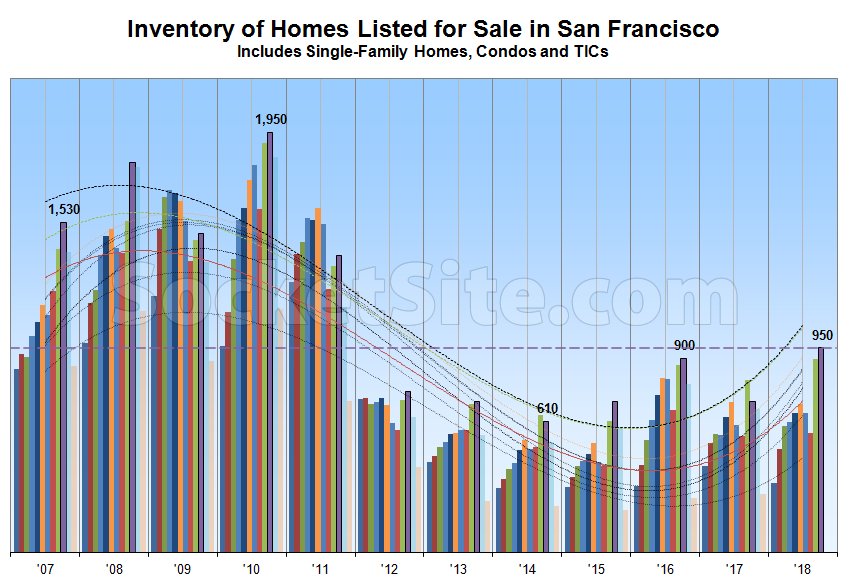
Having hit a 7-year high in September, the number of homes actively listed for sale in the San Francisco ticked up another 6.6 percent over the past month to 950 and overall inventory levels are now running 30 percent higher on a year-over-year basis and 41 percent above their mark at the same time in 2015 (680), the year which remains an inflection point for the current cycle.
At a more granular level, the number of single-family homes currently listed for sale in the city (360) is now running 43 percent higher versus the same time last year while the number of listed condominiums (600) is up 24 percent, not including the vast majority of new construction condos for sale across the city, the inventory of which has been hovering around 500.
At the same time, 22 percent of the active listings in San Francisco have undergone at least one price reduction, which is 4 percentage points higher on a year-over-year basis, while 33 percent of the homes on the market are currently listed for under a million dollars versus 30 percent at the same time last year.
Inventory levels have likely peaked for the year and should start to decline though the end of December while the percentage of listings with a price cut should continue to increase. Keep in mind that recorded home sales in San Francisco were 5.9 percent lower on a year-over-year basis in August having dropped to a seven-year seasonal low in July.
And this is just the beginning. It’s amazing to watch the tide turn right before your eyes. The next year will be very interesting.
Yes indeed. The greed has finally peaked. Not mentioned here is the clincher. A major increase in home equity loans. The magic pre cursor to a collapse. Probably not another catastrophic ordeal as in 08. But the clock is ticking. For S.F a major contributor is our lovely friend Google (along with other major cyber money makers)
As for me? Not this time. No debt, no funky home loans or high loans. I paid big time last time around. Lesson learned (and not forgotten) I’m sitting back and watching this one with a big bag of popcorn.
The smoothed line looks impressive, but it doesn’t fit 2017 at all. It doesn’t look like it would fit 2005-6 very well either.
I believe in a larger economic cycle but the cycle depicted in this chart looks like it’s highly dependent on the choice of graphing parameters. It’s very plausible that the interest rate rise and tax changes could tip us out of the seller’s market. But the dotted lines and the language about where we are in “the current cycle” do not seem to be well supported by the data here.
You are correct – the smoothed lines would fit better in 2016/2017 data was switched around. I agree that the language doesn’t exactly fit the data either, but my takeaway is that we have hit the high point of the market, which can no longer support ever increasing prices, and the interest increases will make sure that we don’t get another respite as we did in 2017.
Now I’m remembering that the editor once explained this chart and the dotted lines are actually the YoY changes, with the y-axis doing double duty. I think the visual effect is strongly misleading.
Per the editor (see namelink):
“The trend lines are year-over-year, measured on a monthly basis YTD. The solid line represents the trend as measured in May, the dotted lines represent the trend as measured in January, February, March and April.”
Two requests:
Data for the lead up to ’07/’08
An explanation of the statistical method used to create the various trend-lines
Upward price pressure is pretty much over. Many factors including a likely sustained period of slow population and job growth in the Bay Area as well as not enough “wealthy enough” techies to keep prices moving north. Add in increasing interest rates and decreased tax advantages and here we are. This is being seen in the multi-unit market too with more and more medium or large projects either abandoned or having their enttlements put up for sale. Condo prices are actually down a tad from their late 2015 peak.
The “typical techie” seems to be price max’d at about 1.5 – 2.5 million for a home. That assumes they have 350K – 550K for a down. It amounts to a total monthly housing payment of 8K – 12K. Don’t know if that is really typical but in the Mt. Davisson area prices have jumped to 1.5 – 2.5 million. Fueled by techies who can’t afford Noe or the better hoods. The are happy to be “barely” able to afford a SFH in SF as many of the new techie neighbors tell us.
Of course this 1.5 – 2.5 million wave could be pushed further out. To Hayward or Pleanton or Livermore. San Bruno, which has been a pocket of lesser home prices close-in, has recently seen a big jump too. So SF and the Peninsula are at high price points for this cycle. These buyers could go further out and push up prices in the outer markets even more. But that comes with a much longer and more expensive commute.
Bottom line, more and more people are looking and will look at leaving the BA for greener pastures where 1.5 million gets you much more than a starter home and comes with a short commute. Adding to the trend, a good number of sellers in my area are not moving down the street or to the Peninsula or to Lafayette. They are leaving the Bay Area altogether.
The economy has not even started to turn yet. Add that to the mix and things will really get interesting.
I don’t know if drastically improving the quality of life i.e. no vandalism, littering, drugs, higher quality education with a sole focus on commerce would help. The above certainly goes a long way in Singapore where I am right now. Clean, safe, wealthy, educated, and green city, drug trafficking is punishable by death. None of the tedious ongoing political gamesmanship prevalent in the U.S. Tech would thrive here because they are still numerous opportunities to grow.
Finance is huge here and every other person I have met is either in finance or medicine, earned their degree in England. I would leave SF for a US$3 bowl of laksa.
$3 laksa sounds good. I would hate to be somewhere where everyone is concentrated so much in two industries though, but agree that’s the way SF is heading which just one industry….!
I’ve been thinking as soon as BART gets to downtown San Jose the prices along the 880 corridor are going to spike and we’ll peninsula like prices in Hayward up to Castro Valley..Fremont etc.
We have been in a plateau for a few years, but the clowns in DC seem interested in damaging the economy, and if demand drops, prices will follow. Not a good time to buy.
Not a good time unless you have a family, need to put children in school, can come up with a downpayment, see crappy rental choices in the 5k/month range in suburbs with decent schools – and compare that to a monthly mortgage…..add all of these up, and you see why people buy in choice BA suburbs There’s enough of these types (including me, bought this year) to hold the plateau, but I agree that a forever hockey stick appreciation curve expectation is silly, as the region hits its limits of tolerable commutes, etc. However, long term, the entire northwest will be a climate haven. This will sadly be an issue in coming decades.
That’s a good point. I should have said notva good time to buy by choice. Buying by necessity always follows different rules.
You may be right about the PNW, but I see dense forests that are designed for heavy rainfall. In a warming and drying world, that could lead to catastrophic fires. It’s easier to find losing climates than winning ones, though, in the coming decades.
The thing is that it isn’t really “necessary” for anyone to live in SF. And as we’ve seen, domestic migration has gone negative. People simply choose to live elsewhere. What makes a high “plateau” unstable is that it involves stretching to get into the market, paying high holding costs and then losing a chunk of equity to selling costs. And if you wait too long and go off the edge of the “plateau” into the downturn, then things get really hairy!
Low down/No Down loans are available, people borrow from family and friends, many many people “borrow from their future selves” by under-saving for retirement. There are many ways for a large group of people to stretch to get into the market and on the upswing it’s “affordable” to them even with high (but rising) prices. Far Far fewer people can stomach stretching into a high “plateau” and fewer still during the down-slope.
I realize how many other factors go into this, but– mortgage rates at 7 yr highs, SF inventory at 7 yr highs, Bay Area home sales at 7 year seasonal lows. And with a slightly longer historical context, rates are still quite low. Lots of factors, but rates matter.
interesting but Calif & blue Democratic state still have a strong economic hold then the red state. We try to bring jobs here, but the cost will be so enormous we can’t complete with China & Mexico. As the red state they asking the government to reduce or eliminate the tariffs cuz they will not survive. as 4 housing n bay area, even though it might b a plateau everyone wants to live n California, no hurricane, tornadoes, but a slight shake rattle or roll, we California’s & blue state will alway servive.
So you are saying that everyone is moving from Texas to Illinois and New Mexico? Don’t think it is a red vs blue state thing…
In related news, Pending Home Sales in San Francisco are Down.
this weeks sales of recent apples:
418 Day Street (Noe Valley): 2016-18 went from 2.65 to 3mm
61 Prosper Street (Eureka Valley): 2017-18 went from 3.225 to 3.41mm
829 Rhode Island (Potrero Hill): 2015-18 went from 2.94 to 3.425mm
4455 23rd Street (Noe Valley): 2017-18 went from 1.75 to 1.95mm
Hold on. Ignoring the flip on 23rd, which resulted from an off-market sale last year, and not accounting for the expansion plans for 829 Rhode Island which were drawn between sales, that bucket of above-average, single-family apples yields average annual appreciation of around 4.4 percent over the past couple of years?
But the median sale price in San Francisco has been running an average of 8.5 percent higher on a year-over-year basis over the past year. And the Case-Shiller Index for San Francisco is up nearly 11 percent over the past year alone!
Regardless, the inventory of homes listed for sale in the San Francisco actually ticked up a little more over the past week and the percentage of homes with price cuts has continued to rise.
I just happened to see these sold this week, and the narrative above is that we are on a plateau, “this is just the beginning”, “upword pressure is over”, etc. But your info. and the few apples show that is not really the case
Sales, rents, pending sales and new condo pricing down. Inventory and reductions on the rise along with a growing body of “anomalous” apple-to-apple declines from 2015. And subpar returns for a little bucket of above average properties is your counter evidence of emerging weakness in the market?
We just see it differently. You note the apples had “subpar returns”, I see people paying more for a house than last year and the year before. i am also seeing lots of sales that I see as showing prices up but as they aren’t apples they aren’t codified and counted. Both fixers and finished houses. And as always when I comment, I am speaking single family houses.
” And as always when I comment, I am speaking single family houses.”
But that’s the thing here. Condos tend to lead SFH’s when the market turns. And we’ve just seen the condo market progress from leading indicators of weakness, to some flat results to 2016 era results 2015 and below declines.
Some people have argued in the past that SFH’s will decouple from the condo market, but the argument for that is weak and it didn’t happen in the last market cycle. And now with the SFH inventory popping up over 40% it looks very much like SFH’s are following the same market turn as condos.
In short, I don’t think anyone would expect the SFH market to be at the same point in the cycle as the condo market. And of your four example, it seems that half weren’t actually apples. And I think the point of the “subpar returns” is that of course you’ll see a deceleration before an outright decline. A while back before condo apples showed outright declines, there were apples which merely showed a deceleration from the double digit gains of yesteryear.
And beware of people misdirecting you towards what hasn’t happened yet and away from what has happened.
Where there were just leading signs of weakness in the condo market, people said ‘but we haven’t seen this in home sales’. And when there were apples where deceleration could be inferred by backing out prior years appreciation, people said ‘but there have been no apples with flat or down prices’. And when there were flat prices at 2017 levels it was, ‘you’ll never see 2016 prices again’. And then there were 2016 apples and people said ‘you’ll never see 2015 prices’ and then there were 2015 and below apples. And people said ‘it’s just condos’ and now SFH inventory is up 43%. And people said the apples must be faked because we don’t see a decline in Case Shiller (even though the CS index is for a much wider area than SF proper), and now CS condo showed a down tick….
In May people screamed that is wasn’t June yet, in June they howled that it wasn’t July, In July they caterwauled that it wasn’t August,… Yet from a big picture view it’s clear that the dreams of an endless summer were just fantasies and summer is slowly and steadily turning into winter as it has done so many times before.
I do not agree with either of the last 2 commenters. As I said, just looked at this weeks sales that seemed like apples maybe some weren’t but they were more expensive than the last recent go round. Apples is somewhat flawed anyway as newly redone isn’t the same as lived in. I do think condos and houses are never fully coupled, plus lots more condos get made than houses. Etc. etc. BTW my sales this week is what “has happened” and not what “will happen.” 680 douglass “will happen”
” BTW my sales this week is what “has happened” and not what “will happen.”
The point is not that those individual sales didn’t happen. The point is that you were directing people towards those sales to show that they hadn’t plateaued.
So ‘what hasn’t happened’ is that this cherry picked subset of NV SFH’s hasn’t plateaued (at least not yet). But what has happened is that even this cherry picked subset has decelerated from the breakneck pace of yesteryear. Plus everything the editor points out with regards to “Sales, rents, pending sales and new condo pricing down. Inventory and reductions on the rise along with a growing body of “anomalous” apple-to-apple declines from 2015. ” Plus changing migration trends….
You are running out of places to hide the rabbit!
Say you are on the 10th floor of a building and you hear that the 1st floor has caught on fire. Then the 2nd floor catches on fire and then the 3rd, 4th, 5th, 6th, 7th… But on the tenth floor, the temperature has risen 15 degrees and smoke has started to waft through the air.
Do you focus on the fact that the 10th floor is not currently on fire? (i.e. what hasn’t happened). Or do you focus on the fire raging on floors 1-7 along with the growing heat and smoke on the floor where you reside? (i.e. what has happened)
While it is technically correct to run through the halls screaming that ‘The 10th floor is not on fire’ it’s not very helpful and it ignores the likely outcome that all the other events (what has happened) are leading to.
That is not a thought experiment. That is asking strangers to indulge your deadly metaphorical writing. Get a grip.
I think that for many people, the cost of enduring a little metaphorical danger will be well worth the benefit of avoiding the very real financial danger of catching a falling knife! (Or incurring the very real financial opportunity cost of not ‘getting out while the getting is good’!!)
I didn’t cherry pick anything. I looked at every sale from the week before and there were that many apples at my quick perusal. They had not plateaued. “decelerated from the breakneck pace of yesteryear”, okay but still going up. That is all I was showing.
Also this week, in the specific segment you picked: 492 Douglass (Eureka Valley), which just sold for $4.3 million having been purchased for $4.6 million in August of 2017, down 6.5 percent over the past year on an apples-to-apples basis.
Okay that one is down for sure, didn’t realize it was a resale.
But I submit to you that $3.5mm in Inner Parkside does not show a dropping market.
That’s certainly up from 2009 (in West Portal)! What did the same home fetch in 2017, 2016 or the year before that?
Not a recently apple= doesn’t count toward price increases.
Okay. Probably would have got $4mm and prices are way down.
Not at all. But simply pointing to an expensive off-market transaction, which was actually in West Portal, does’t make for the strongest of arguments or evidence.
I wasn’t off market. They had open houses and a sign out front. They are just trying to hide the sale price. The rest of 15th Avenue is inner parkside so my bad on the proper realtor language.
So really I should have just said “Highest West Portal price ever” and left it at that.
As you likely know, that’s a fairly unique little strip of large houses. It sold without ever being listed. And as you likely also know, the sale didn’t fetch anywhere near the highest price per square foot that’s been paid for a home in West Portal.
Why is that one flagged ‘For Comp Purposes Only’??
It didn’t get the highest price per foot but it got the highest price total.
West Portal has a lot of unique homes, these are less so as they all match.
Plus these houses have mid40s aged men riding razor scooters in front of them. That has to bring down the value.
The biggest houses in a neighborhood do tend to sell for the most overall.
In a sellers market they do
In any market, actually. At least according to the data versus one’s recollections or gut feeling. It’s the relative price per square foot that shifts based on market conditions.