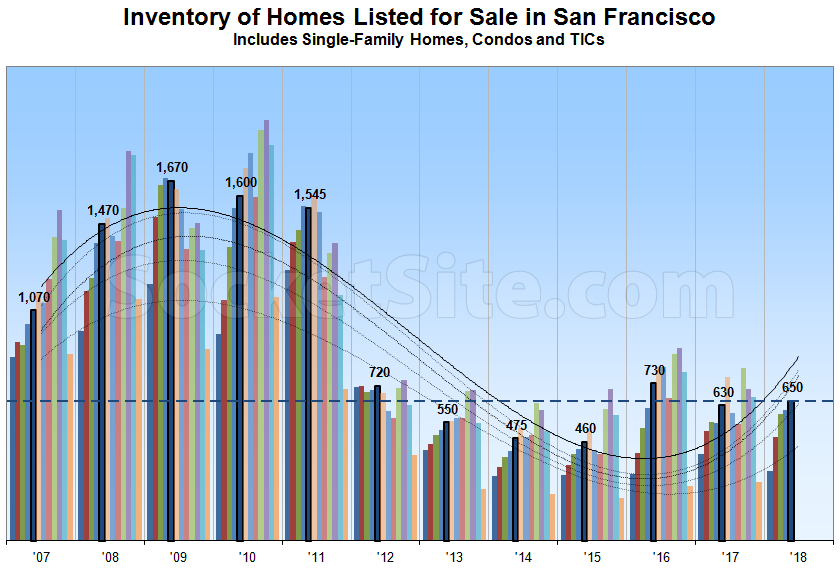
Driven in part by a pronounced slowdown in sales activity since the end of last year, the number of single-family homes and condos actively listed for sale in San Francisco (650) is currently running 3 percent higher versus the same time last year (630) and 41 percent above the current cycle low for the first week of May (460) which was set in 2015.
At a more granular level, the number of single-family homes currently listed for sale in the city (230) is roughly even with the same time last year while the number of listed condominiums (420) is running closer to 4 percent higher, a total which doesn’t include the vast majority of new construction condos for sale across the city, the inventory of which is currently around 550.
In terms of pricing and expectations, 13 percent of the active listings in San Francisco have undergone at least one price reduction versus 17 percent at the same time last year while 32 percent of the homes on the market are currently listed for under a million dollars, matching the percentage at the same time last year.
And with respect to sales activity, the number of homes currently under contract, a total which isn’t include in the active inventory numbers above, is hovering around 450 which is down around 3 percent from the weekly average in April.
Expect inventory levels in San Francisco to continue to climb for another month in the absolute before dipping around August and then climbing again through November before tailing off through the end of the year, as tracked and trended above on a monthly basis since 2007.
Is this adjusted for inflation in the number of homes in SF? San Francisco Contains more homes than it used to. It’s a small effect on a year to year basis, but it would add up over time.
I like the attempt to show seasonality. Bucketing the data by season might convey most of the background information in an easier to read way – show the average volume per month for the current month against three periods, like Dec..Feb, Mar..Jul, Aug..Nov instead of the twelve monthly values.
Something seems odd about the smoothed curves here though, why is the smoothed value for this May higher than any May since 2011? What is that curve anyway?
The trend lines are year-over-year, measured on a monthly basis YTD. The solid line represents the trend as measured in May, the dotted lines represent the trend as measured in January, February, March and April.
So many folks trying to cash out. $2k a foot makes buyers think twice about investing in this market.
Keep in mind that the median price per square foot of all properties currently in contract in San Francisco is actually around $930 per square foot (and which is actually down a percent from the first quarter of the year).
If someone offered me $2k per square foot for my place I could be out tomorrow morning.
Likewise!
me too
This seems like as good a place to ask as any….does everyone on this thread think it’s wise to cash out? This feels precarious. But things keep selling.
If I were in it for the short term, this is as good time as any to cash out. If long term, I would hang on unless maybe you have a high rise condo. The next dip will probably be more like 2000 than 2008. Then you have some tailwinds in terms of millennial demographics, also the economy is much worse under the hood today and printing more money is the only bullet left in the gun, which is supportive of asset prices.
Interesting thoughts… thanks for the comment