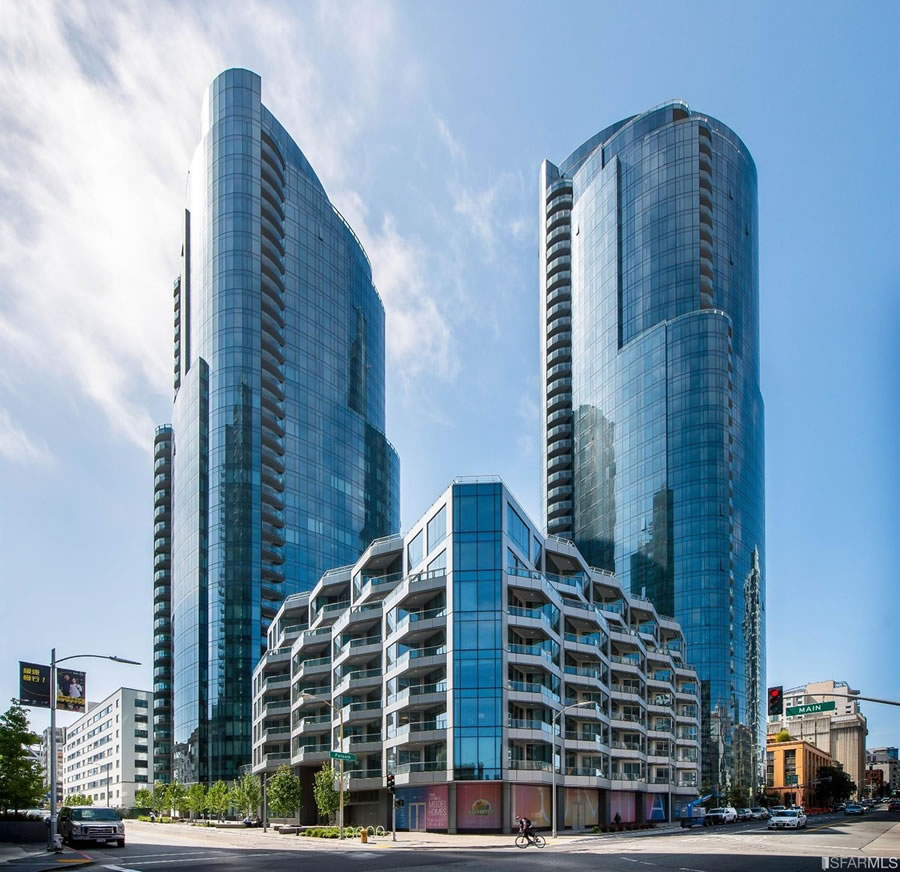
Purchased for $2.425 million in April of 2016, the two-bedroom unit #22E in the LUMINA tower at 338 Main Street returned to the market looking nearly new and priced at $2.488 million this past June, a sale at which would have represented total appreciation of 2.6 percent for the luxury unit over the past three years on an apples-to-apples versus “median price” basis.
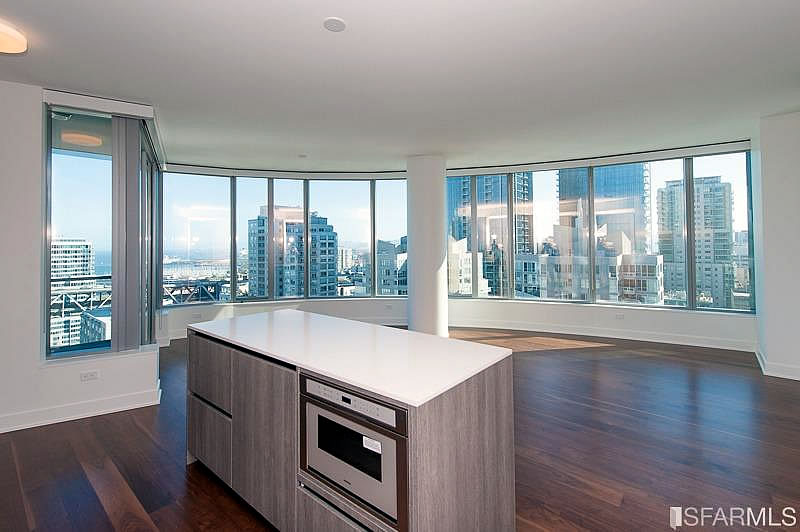
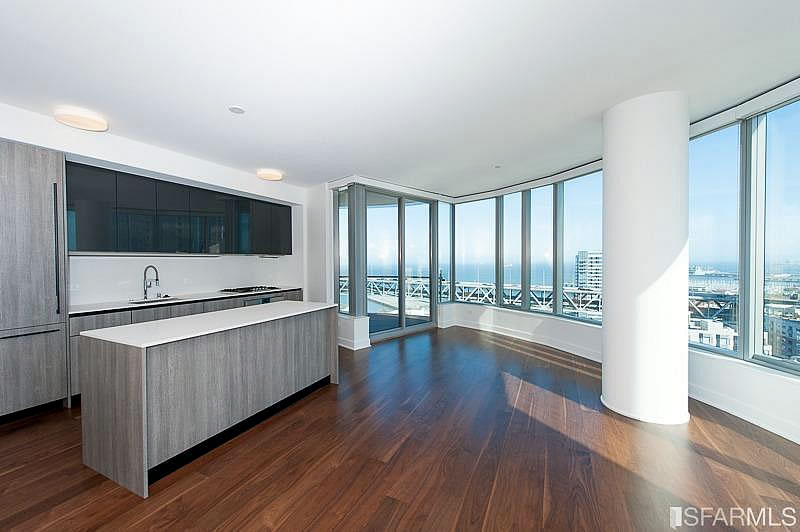
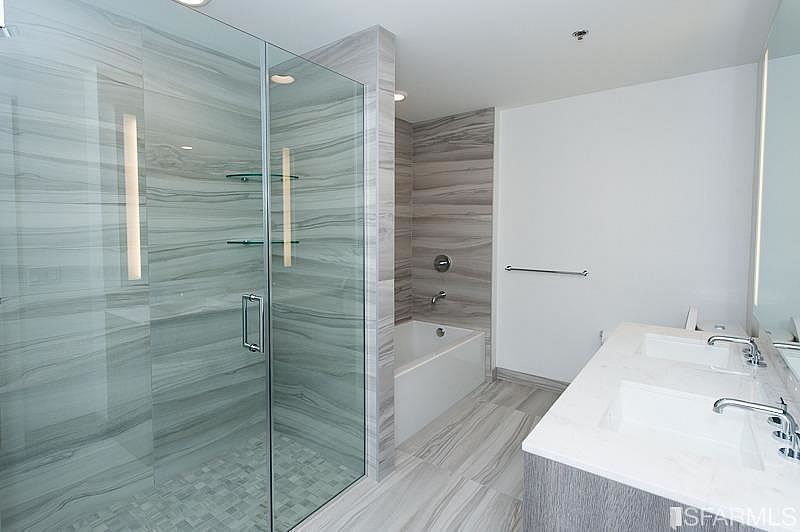
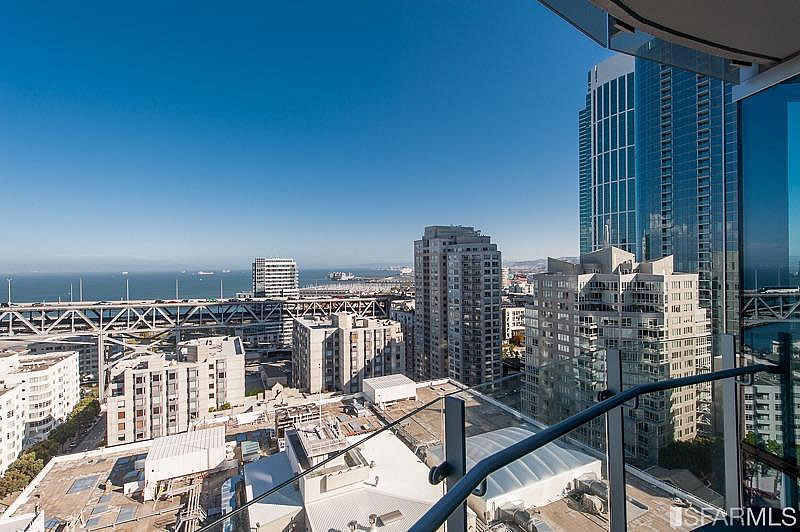
In addition to two bedrooms, the 1,382-square-foot unit comes with two full bathrooms; sweeping views of the Bay, Bridge and city below; and a transferable valet space in the garage.
For those running the numbers at home, the 2016-era purchase was made with 35 percent down, a below average 2.848 percent interest rate on a $1.58 million loan, a second home rider disallowing any rental of the unit or its use as a primary residence (hence its current condition) and HOA dues of $1,210 a month.
And having been reduced to $2.438 million in July, the list price for 338 Main Street #D22E has just been lowered to $2.388 million or 1.5 percent below its 2016-era price.
Will the “second home rider” apply to the new buyer? That would seem to constrain the market rather substantially.
No.
Can’t live in it as a primary residence and can’t rent it out? Who placed the rider on the home?
The bank, at the request of the borrower, in exchange for the below average mortgage rate.
So it was only used as a second/vacation condo by the owner. Why would the bank require that in exchange for a below average mortgage rate? Presumably the buyer used it as an investment – hoping to see major appreciation – those were still the days of frothy exuberance.
Yeah, I’ve been scratching my head thinking about that. Only thing I can come up with is that, as a second/vacation home for the owner, maybe the lender thought the foreclosure process would be faster to execute on if it came to that since the owner/borrower/mortgagor wouldn’t be living there full time and there wouldn’t be any potential tenants to kick out, either. In 2016 the memories of 2009-era “strategic defaults” by homeowners would still be a fresh memory for most people on the lending side.
also maybe no risk of having a tenant trashing or downright sabotaging the place.
Ya I was thinking about this too. Essentially this was bought strictly as a speculative investment.
Cant live in it
Cant rent it out
Bank was obviously protected with the huge down pay / thier risk was pretty much limited to a 10.0 earthquake taking out the city or a nuke or a comet. Basically zero.
2.85% to borrow 1.6M and assume (hope) the building appreciated. plus all the HOA, sales fees and so on. So youd have to cover the interest rate + all the fees just to break even first. Already a stretch. In a period of only a few years too?
Wow
No need to run numbers….
Am I missing something here?
The opportunity cost of the money. This place could be rented for 5K/month (a guess) or 60K/year. Income that would have been there if they had purchased a place w/o the no rental restriction. They must have been novice real estate investors/speculators which is an easy way to lose one’s shirt – as they did.
my prediction: this unit will go for $2.049M after a few rounds of repricing until it reaches $1.999M asking
Isn’t this in the $2M+ sweet spot the Realtors/boosters keep telling us has ultra strong demand?
Apparently, that sweet spot is not as strong as it was in 2016.
Well, Unit 32E in this same building, 3 bedrooms and 3 bathrooms, sold in the middle of last month for $3,500,000 after listing for $3,549,000 in July, so about 1.4% over asking in 38 days. Is that evidence for “ultra strong” demand or is it just outperforming the rest of the high-end market?
Assuming you mean under asking? Or look at 338 main 35c that sold under asking with nearly 2 months on market before going into contract. There’s always going to be various data points but need to look at the entire building or area or market to determine trend
NA, of course you’re correct, I can’t even claim that I fat fingered.
You’re also right that we have to look at the entire building; the subthread was regarding the $2 Million and over segment of the market, which 338 Main St Unit 35C is definitely part of.
Unit 21c in the same building was listed in April of this year for $2,900,000 and sold for about 2.5% under asking last month. Doesn’t portend great things for Ohlone Californio’s hypothesis if that’s representative of the market segment as a whole.
Why are you simultaneously talking about not taking a singular property and expanding upon it, and then taking a singular property and expanding upon it? With “under asking” as a criteria? Why is under asking a thing on here, but over asking is not? I always wonder that. Anyway, didn’t unit 21C sell for 2.825M in 2018 for a significant gain over its initial 2016 purchase? What would that portend, and why?
I fully concede that we’re trading anecdotes here. There happen to be a fair number of units trading at 338 Main Street in the $2 Million and over segment over a fairly short time period, at least that’s what’s drawing my interest. It might very well be idiosyncratic to this building, as I allowed above.
Data, numbers were shared. They are what they are.
Meanwhile the understanding you’ve shared of SOMA developments remains nil. The insight you share into the local market remains negligible Yet the latitude you enjoy with regard to broad and ultimately unfounded missives on this site remains broad. Odd stuff.
Weirdo unit with weirdo terms, not a good signal of market, a fun lil financial curio.
I don’t think the views are all that great for the location, either.
Second home riders are neither “weird” nor unusual and are specific to a loan, not a unit (and this unit’s views are actually above average for the building). But if you’re looking for other signals in the same complex…
Been eyeing this site now for a while, this is a huge complex with 656 condos and lots of resales. plenty of listings have sold around ask here, but you don’t see any of those mentioned here . this socketsite guy loves posting about the ones that sit around. He literally has 3 separate articles about one unit that sat on the market and got repriced a few times. Not sure what his agenda is, maybe bitter /broke or trying to capitalize on some angle. Market is flat/down some, no surprise there. Units are still selling tho, so take the ‘news’ you see here with a hefty grain of salt, it is far from unbiased
You might need to see an optometrist.
An “over/under asking” sale is a reflection of pricing, and perhaps expectations, not the underlying market itself. That being said, we’ve noted plenty of “over asking” sales.
And while we do go looking for potential “apples-to-apples” sales, we select them prior to knowing where they’ll land. A case in point is the very post upon which you’re commenting (albeit without any insight into the actual unit/building/market at hand), which will, in fact, turn into a second post, or perhaps even third, once the market has spoken: up, down or otherwise.
these examples highlighted by socketsite are valuable and serve a useful purpose in cautioning potential buyers of what “can” happen if one gets too exuberant when paying a too much, especially for new condos at a high per square foot price. one can’t easily find this kind of information on their own because the industry participants hide or obscure all of it.
nobody’s seeing these anecdotes and assuming the entire market has crashed or that condos are necessarily a bad investment. Clearly, we know that SF real estate has generally made long term buyers a lot of money, and these anecdotes of single condos are not trying to refute that.
Withdrawn. No sale, even listed at a loss. The $2M+ sweet spot appears to have soured.
Yeah that must be it. This re-traded condo at the Lumina proves it. Never mind the year over year figures. Your words are always merely pointless needling. That they aren’t summarily deleted reflects poorly on this website.
Interestingly enough, home sales in the $2 million and up segment over the past year are currently down on a year-over-year basis (albeit by only a few percent versus a larger drop, year-to-date, for the market overall).
I just looked at it. It’s currently showing that 2019 is down a grand total of 2 sales, 894 versus 896. But average $ per foot is up, $1172 this year versus $1147 last year. Also August year over year shows it’s slightly up this year at 102 versus 99. And price per foot up similarly 1171 over 1157. August’s tally will likely ultimately have a few more sales trickle in as well. So it will wind up being up in both volume and price.
We’re guessing you’re limiting your query to a year-to-date sales comparison (versus a full year-over-year). And of course, the average sale price per square foot can, in fact, increase while values, measured on an apples-to-apples basis, are actually on the decline, particularity during a period when the overall inventory of newer $2+ million properties has been on the rise.
Yes, year to date. Why would it not be year to date versus year to date? And fall of 2018 saw a slowdown anyway. You fostered an environment of crowing regarding same. Do you not recall?
Cherry picked apples as “values, measured on an apples-to-apples basis” ?
No.
Cherry picked apples.
Values, as in dollars per feet, are up.
And once again, the average sale price per square foot can, in fact, increase while actual values, as measured on an apples-to-apples basis, are on the decline (particularity during a period when the inventory of newer, and relatively more expensive, $2+ million properties has been on the rise).
How could this be cherry picked? The post went up before the unit was withdrawn.
I guess they deleted my comment or something. I referred to the “measured on an apples-to-apples basis” link that was utilized twice in a row.
A link which simply leads to an expanding cart of apples, the outcomes of which were – or currently are – unknown prior to being picked (such as this one which has since closed escrow, this one which was withdraw, this one which has been newly reduced, or this luxury unit in a more established neighborhood).
And of course, there are plenty of “up” apples in our cart as well, but for some strange reason they’ve been getting fewer and farther between.
Nonsense.
Why don’t you take all the condo sales since say August, in the areas you feature on here, SOMA and South Beach, and post them? Let the readers see for themselves how few show declines since previous sales. And then, taking the ones who do show losses, allow your readers to understand upon closer examination, why a building may have lost value. As we’ve already seen a nearby building taking views away, etc. Because other than lofts, which have lost a lot of desirability to a sizable portion of buyers, that is what’s going on.
But you won’t. You’ll stick to selectively cherry picking and editorializing.
And yet this loft actually traded up, as did this one (apparently we need to work on our “cherry picking” skills). This wasn’t a loft (nor in SoMa). And exactly which views are being taken away from the unit above (or here or here or here or here)?
But we must admit, the consistency with which you mischaracterize our approach, not to mention the market at hand, is rather impressive.
So you cherry pick to counter my cherry picking criticism? of course some lofts trade up. Especially the quote unquote “architecturally interesting” ones in true old manufacturing buildings, etc. These sorts of properties are firmly in the minority as to the mass amount of “live work” lofts that were created in the 90s and early 2000s.
I won’t be spending lots of time to preemptively counter whatever parsing-minutia exceptions you can muster to my writing, thanks. Not when big picture you’re utterly incorrect and it’s quite easy to display same.
You’ve nothing to counter my characterization of the market at hand.
In fact, your errant “2M and over is now down year over year,” is now dated. It’s up, 906 versus 903, and 1171 per foot versus 1147.
Secondly, your parse as to “are you taking year to date versus year to date” was a nonsensical obfuscation.
This site is broken clock theory anymore when it comes to the marketplace.
Actually, “home sales in the $2 million and up segment over the past year are currently down on a year-over-year basis” (which is why we tried to clarify the “nonsensical obfuscation” that you appeared to have missed). And of course, despite claims of a “spring time bounce” that was right around the corner (just wait, you’ll see), year-to-date sales in San Francisco remain down.
At the same time, indexed appreciation for Bay Area homes has been dropping (despite lower-cost segments having helped to prop the overall index up) and the goalposts for counter examples of “apples-to-apples” gains keeps getting pushed back (from one year flips, to two year holds, to three year holds, to four year holds, and now back to 2014).
How are the socketsite possible apples selected? It isn’t every house/condo that re-hits the market when sold in 2014 or later. There must be some formula to it, what is that? Everything that is linked in this thread is units, condos, and lofts. What about single family houses, are those not in the cart?
Anyway, that’s wrong too. Because 2M and up sales of SFRs, Condo/TICs and 2-4 units are not down over the past year, 9/21/18 – 9/20/19 versus 9/21/17 -9/20-18. They are up. It’s 1252 sales versus 1244 sales. And it’s $1158 per foot over $1134 per foot.
You might want to back out multi-unit apartment buildings and try again.
I did that. It’s still up. 1019 over 1003, and $1239/ft over $1223/ft.
I’m still right, you’re still wrong. And by all means do feel free to stay right here when I need you, once the late fall 2018 lull comes into play.
At least you’re getting closer, in terms of what you should actually be counting. Only now, it would appears as though you’re actually missing a few hundred transactions.
Regardless, while demand for properties above the $2M mark has been relatively strong, it remains the minority of the market. And overall, sales in San Francisco are down.
Why would anyone discount 2-4 unit buildings in SF of all places? So many SFRs are actually 2-units, for one thing.
Secondly, I don’t doubt that corelogic shows more condo sales than the MLS, as many condo sales are conducted via proprietary channels. That doesn’t change the fact that the MLS, which, again, this website relies upon mightily and in many ways, is a control here. Its criteria remain constant year over year.
“Why would anyone discount 2-4 unit buildings in SF of all places? ”
Because a $2M SFR and a $2M 4-unit are two very different things. Makes no sense to lump them together really.
Also, feel free to go back to any other year and compare 2M and up sales to this year’s …. the numbers aren’t remotely close.
“How are the socketsite possible apples selected? It isn’t every house/condo that re-hits the market when sold in 2014 or later. There must be some formula to it, what is that? Everything that is linked in this thread is units, condos, and lofts. What about single family houses, are those not in the cart?”
Great questions went unanswered there.
Why no response to these questions, by the way?
Where are your apples posts about resales with single family homes showing big gains over the last 4-5 years or less?
Where are those?
What possible reason would there be for such posts to not be part of this website?
You feature condo resale losses. What about singe family home gains? Why not? Answer the question.
Does 2019 2M and up year over year gains (over an all time peak year, that is, 2018) have nothing to do with IPOs?
If not, then why not?
UPDATE: Luxury Two-Bedroom Fetches $225K Less Than in Early 2016