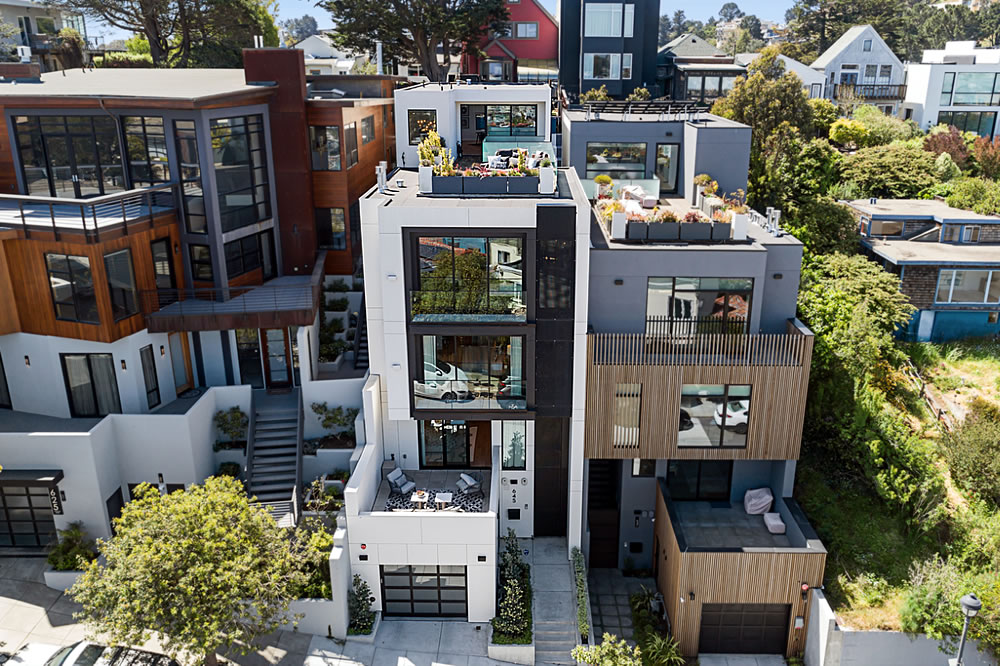
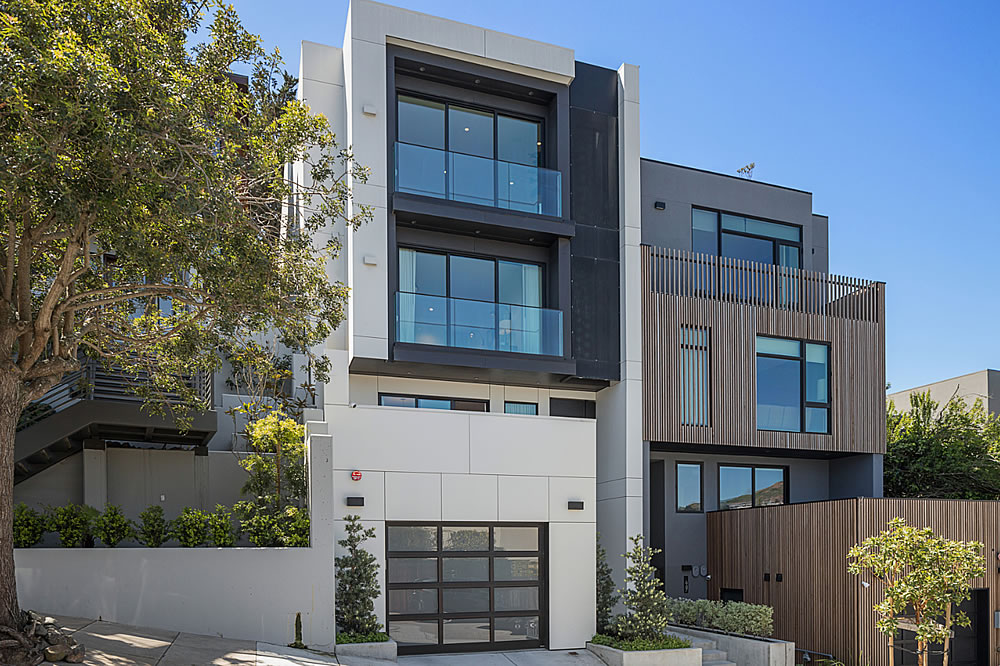
Having overcome a rather ironic effort to block its development, an effort which was positioned by the owners of the 6,000-square-foot home next door as a fight to preserve “the character and charm” of the neighborhood, the 5,165-square-foot Noe Valley home at 645 Duncan Street finished up construction in 2018 and sold for $6.6 million that November.
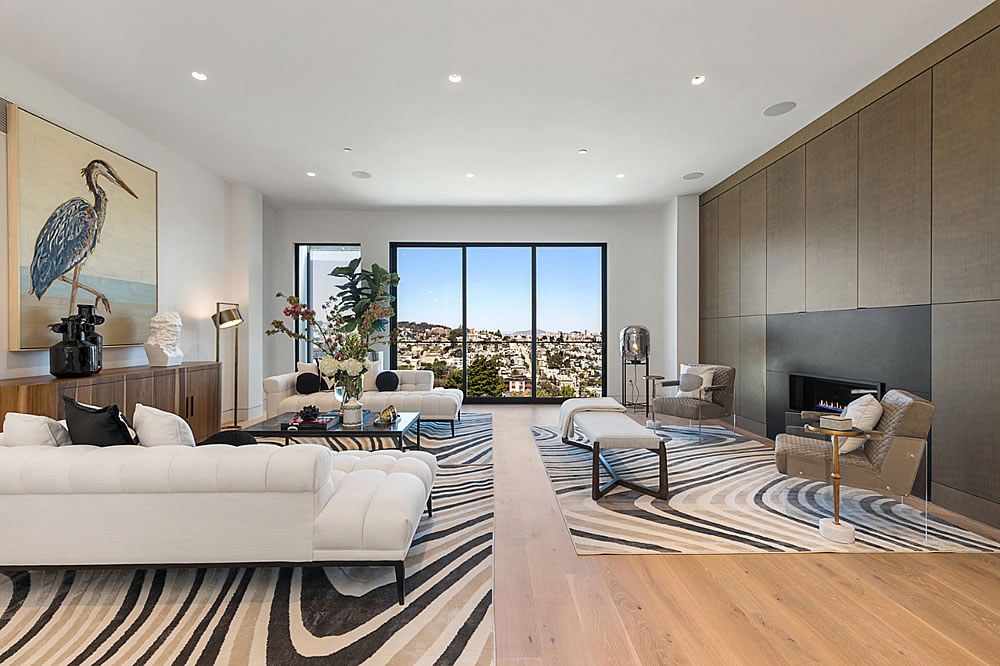
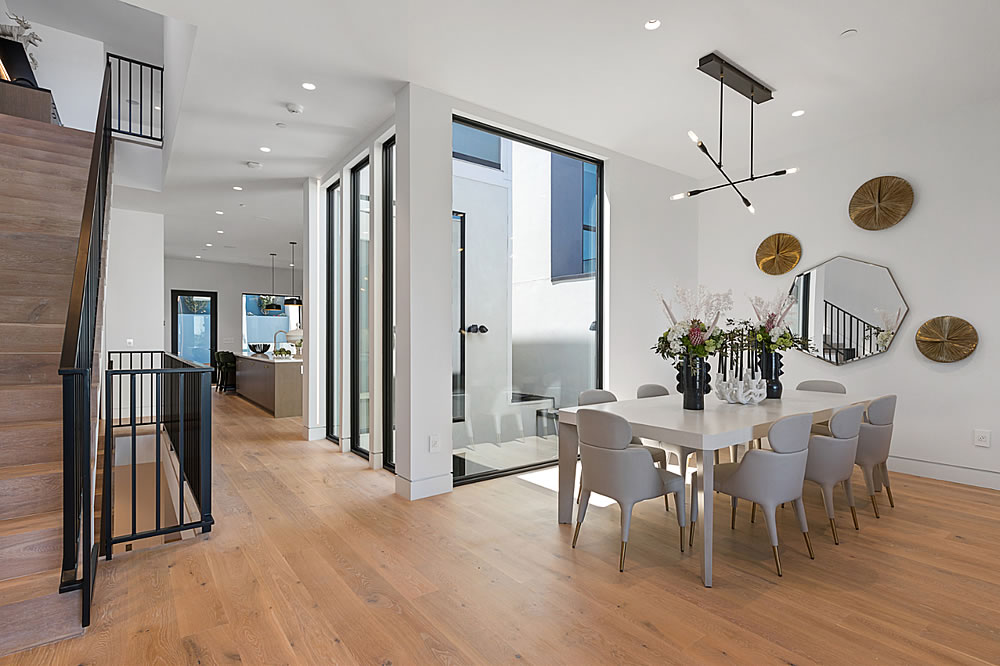
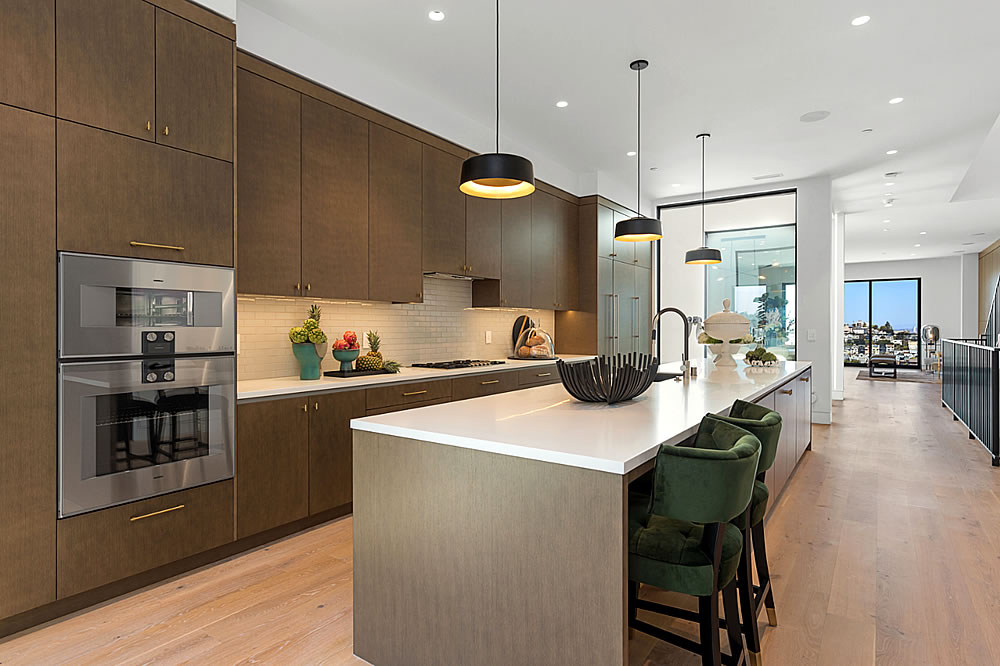
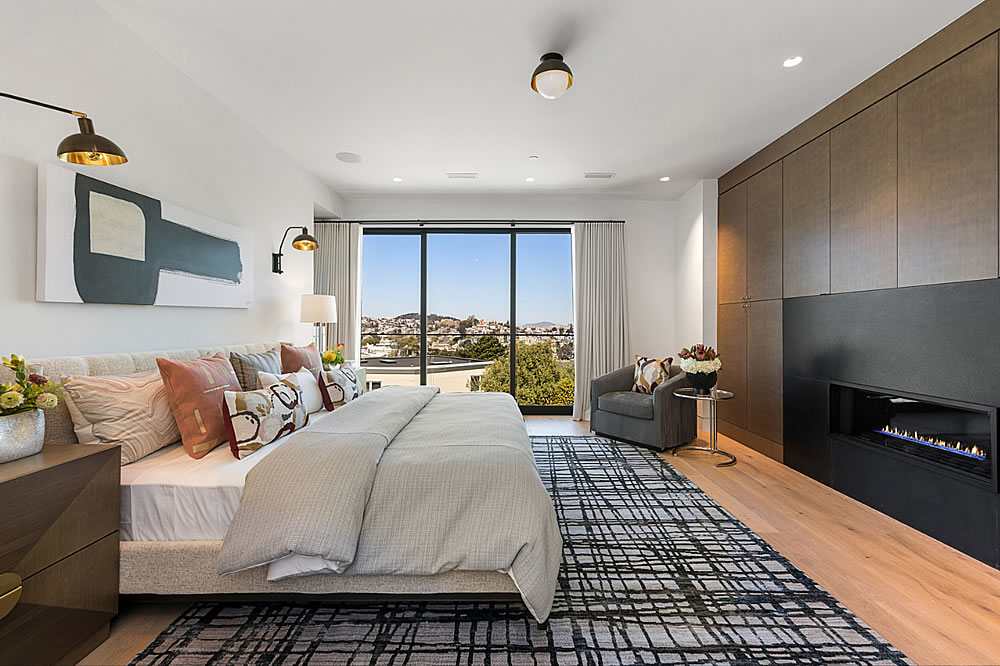
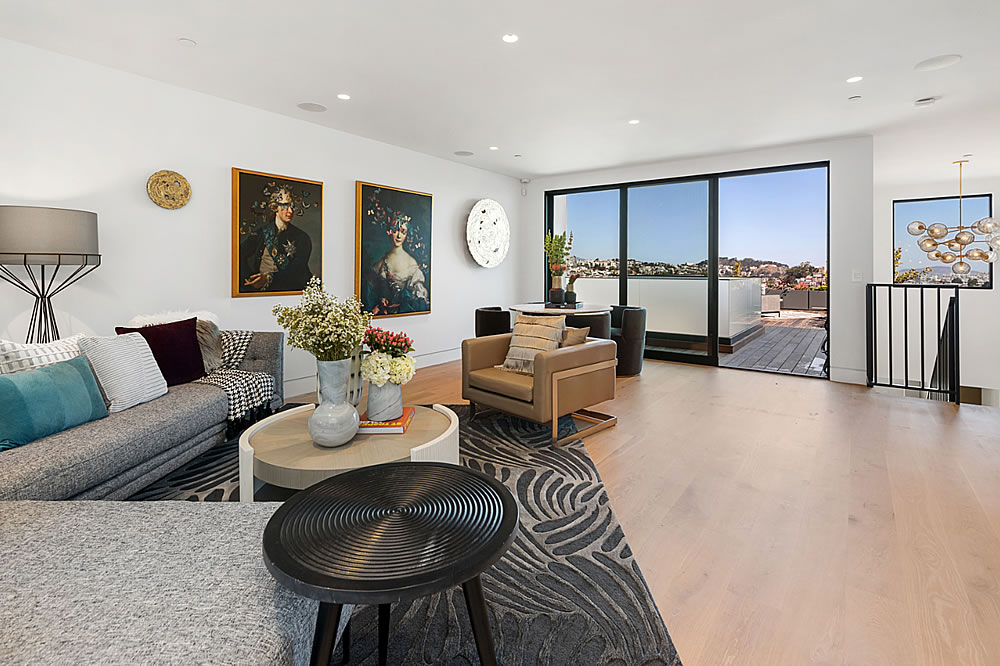
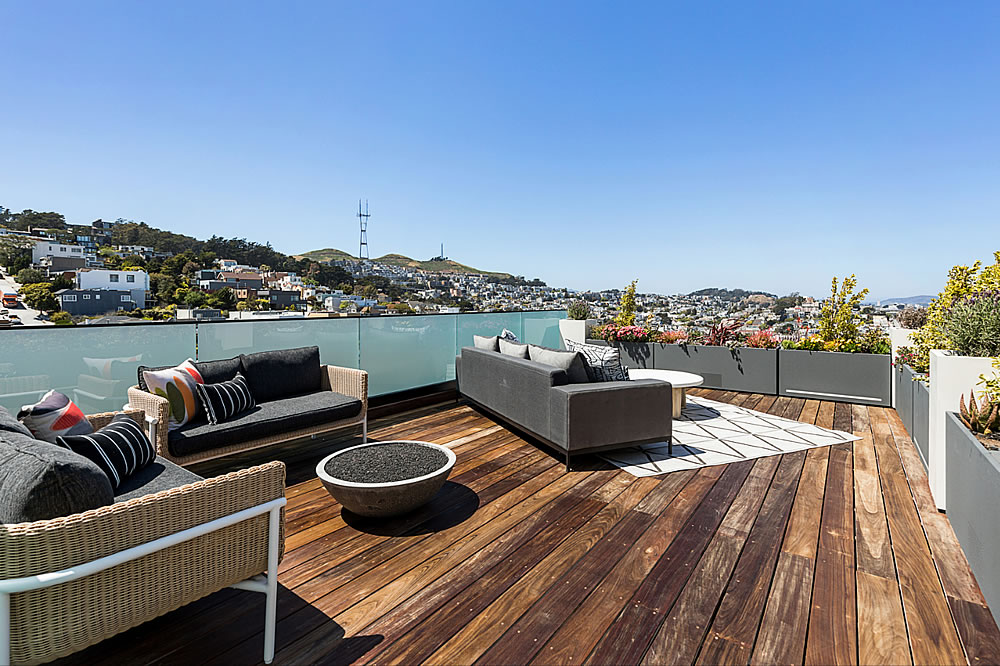
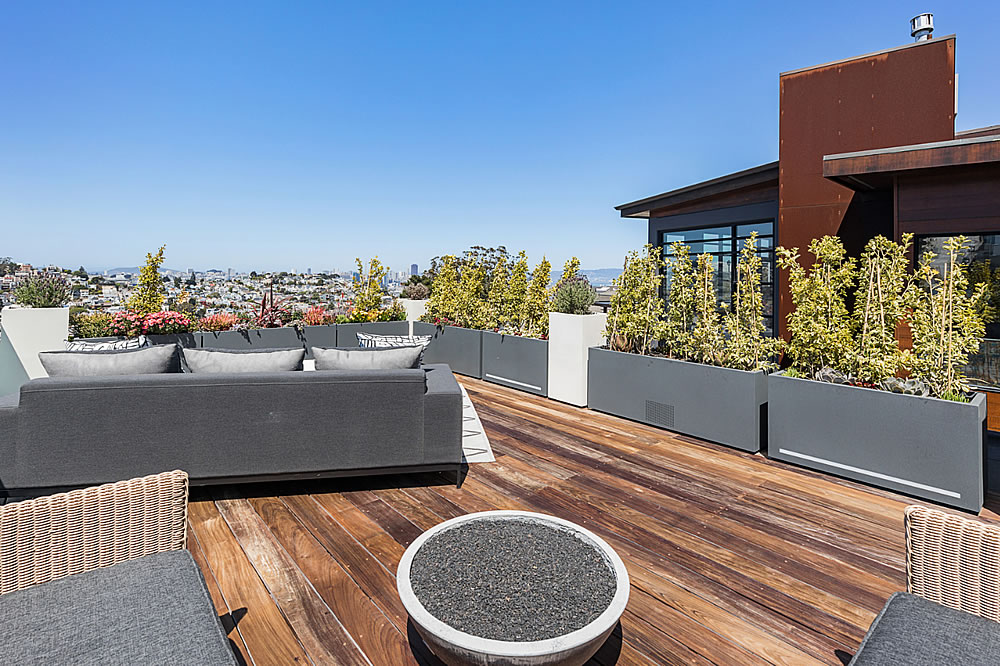
The five-floor, four-bedroom home with a three-car garage and elevator between its floors features a contemporary interior, with high-end finishes, sweeping views and a top-floor family/media room with a wet bar, bathroom and roof deck.
And having returned to the market listed for $6.6 million three weeks ago, the resale of 645 Duncan Street has closed escrow with an “over asking” contract price of $6.7 million, representing total appreciation of 1.5 percent for the high-end Noe Valley home since the fourth quarter of 2018 on an apples-to-apples basis.
The index for Bay Area (“San Francisco”) home values, the latest installment of which will be released tomorrow, is up 12.5 16.1 percent over the same period of time.
Anyone who buys a brand new home, or a home that is thoroughly renovated just prior to purchase, should not expect his/her investment to appreciate at the same rate as the average home over the same time period. This would be especially true in the trendiest product in the trendiest neighborhoods. Be it a Lumina condo or a Noe Single Family.
That this house is trading higher from a 2018 price seems reflective of a market returning to strength, inflation, low rates, post-pandemic optimism, or some other combination thereof.
Nearly $1,300 psf for over 5Ksf in a city with FIVE HUNDRED SALESFORCE TOWERS WORTH OF EMPTY OFFICE SPACE or whatever it is, seems like a strong sale to me.
Haven’t sale prices per square foot in the city proper been roughly flat since 2018, even pre-pandemic?
I believe condos have been choppy / flat, but SFH’s continue to go up. Smaller SFH’s, especially in the outer neighborhoods, continue to appreciate, whereas some of the monster homes in Pac Heights / Noe etc haven’t done as well lately.
Speaking of “nearly $1,300 per square foot,” that was actually the average sale price for a single-family home in Noe Valley a few years ago. But said average has inched down over the past year or two, not to mention over the past six months, to around $1,250 per foot.
And while the notion that new homes and condos tend to underperform the market is incorrect, older homes do offer the potential for additional “alpha” returns through remodeling or redevelopment, a yield that is often conflated with “appreciation” in industry stats and analysis.
Okay, let’s wait a week until the next story about a just-flipped house or post ipo condo underperforming….
While this home dramatically underperformed the Bay Area index, as has San Francisco proper, it actually outperformed its local peers on both an apples-to-apples and price per square foot basis with total appreciation of just 1.5 percent since the fourth quarter of 2018, which shouldn’t catch any plugged-in readers by surprise.
At any point do you plan to talk about this calendar year in SF so far, in terms of single family homes and condo sales volume taken together, looking like the top selling year of all time? I had to go back to 2004 to see any year even close YoY 1/1 – 5/25.
1300 / sq ft. on the nose for 18 Manzanita. just closed. good little one block street.
And having sold off-market for $1,258 per square foot in the third quarter of 2018, that’s total appreciation of 3.3 percent over the past three years for the “beautifully renovated,” and above-average, Laurel Heights home on an apples-to-apples basis. At the same time, the average sale price per square foot in Laurel Heights has actually inched down, from over $1,100 per square foot two years ago to around $1,075 per square foot over the past year. And the Bay Area index for single-family homes is up 14.5 percent over the same period of time.
Whoever bought the larger and way nicer house next door for 4.4 million in 2015 must feel like a genius.
Ego-driven, neighborhood-destroying monstrosities, all. A whole row of middle fingers to what was once San Francisco.
I see them as a net positive, mostly related to property taxes.
Aesthetically, I’d call the cottages and these large modern homes a wash, but that’s a matter of taste. The same number of people probably live in them, so it’s a wash there, too.
However, a cottage assessed in 1997 at $300K was giving the city ~$3K/year in taxes. This house gives ~$66K/year. Say what you will about the city’s budget efficiency, but another 63K *every year* helps fuel park renovations, transit projects, etc. A massive remodel also pays off every construction worker along the way. In a sense, it’s a redistribution of wealth back to everyone else.
thank you. this is the correct analysis.
I had to laugh. Have you actually read the SF City budget? I mean the really detailed one. I’ve done a deep dive every now and then for decades and nothing changes. Waste and graft on a truly spectacular scale.
I use the San Jose one for comparison (which is not exactly impressive either) and SF tax payers are paying for sub standard / no standard services at two to three times (at least) the cost of any equivalent city. And those cities are mostly badly run too.
You could cut the City budget by 70% / 80% and notice no difference in the quality City services. The schools would still be terrible. The streets would still be full of potholes. And MUNI would still be a joke. As is the housing dept. But there sure would be a lot of City workers out of a job. A job that pays far more than the private sector equivalent. Or public sectors jobs in other cities for that matter.
So a higher tax take just means more money for the City to waste and steal. City services sure as hell wont improve. I’ve seen the City basically bankrupt and seen the City with so much cash it could not spend it fast enough. Services were actually a slightly better when the City was bankrupt. After enough of the City middle management dead-weight had been fired or jumped ship.
The only people the tax money is being redistributed to is City workers and those with the right “connections” in City Hall.
I see your general point (and acknowledged it in my original post) but I disagree on details.
– “The schools would still be terrible.” San Francisco Unified is ranked 688th out of 1496 in California which is not “terrible.” The schools that bring down the average are the lower income areas in the southeast. School quality is mostly a reflection of the neighborhood it’s in.
– “The Streets would be filled with potholes.” SF recently received a grade of 75/100 on road quality which is considered “good” and is higher than the region.
I’m open to a data driven analysis if you have one.
Lived in SF four decades, Sent kids to private schools starting in the 1990’s. Worth every penny. Eldest getting their PhD. If you had kids you would know first just how bad the public schools in SF are. And have been since the 1980’s. Why do you think SF has the lowest percent of kids of any major metro. Those families who cannot afford private schools and want a good education for their kids move. Talking to old timers this exodus started in the late 1970’s / early 1980’s.
“Surveys” tell you little or nothing. First hand experience is usually very different from those surveys.
As for pot-holes and general street dilapidation in SF. The worst was the early 1990’s. Still nowhere near that. Yet. Or even East Palo Alto back in the 90’s for that matter. But the pandering to the 1% who cycle (a number that has not changed much in five decades) at the expense of everyone else has made driving much more unpleasant. Turning arterials like Army St into parking lots. The immense waste of transportation resources on basically the 1% rich white people who use cycling as a purely discretionary mode of transport. Driving around SF on a wet day will show you just how little has changed in the percentage split of primary mode transport in the last four or five decades. Based on census data series going back to the 1950’s.
When it comes to data pretty much all I have seen for SF needs a good bit of nuanced analysis. Based on comparing with actual day to day experience. Most of these “surveys” have some ulterior motive (or not a very good grasp of basic mathematics) and as such need to be put through a serious BS detector. A good example is crime statistics. SF is now as dangerous as right before Three Strikes passed in the mid 1990’s. But you wont see that in any official statistics. For a start so much crime is now unreported as the City DA will not persecute. So why bother. We are not quite back to doing rolling stops at red lights downtown at night. Like back in the 1980’s. But we are getting close.
And as for my original point, institutional political corruption in City Hall leading to immense wasteful spending. You have to have read the newspapers closely for decades to even get even half the story. And read the budgets. Look at the accounts. And know your City history. Because you wont read very much about it in books or “surveys”.
Like the reason why MUNI will always be dysfunctional is the same reason why street cars disappeared from city streets back in the 1950’s and could only be replaced by light rail. A very San Francisco story. The only way to fix MUNI is to abolish it. But that will never happen. Unless another Sunny Jim Rolph comes along and charms the City back to better government.
being in the middle of the pack for a state school system that is ranked 42nd in the nation would qualify as terrrible
While I do appreciate the irony of vacant lots representing the golden era of San Francisco, I do find it preferable that there’s a dwelling here, and the $82000 in property taxes they pay every year is pretty nice.
I just entered “ego-driven, neighborhood-destroying monstrosity” into Google’s Hyperbolese-to-English translator and it returned “place I’m angry I can’t afford”.
Yeah, don’t even give it a second thought. The fact that it’s easily understood that this, rather isolated and specific, row of oh so fine SF housing stock was previously nothing more than 2 vacant lots and a decrepit cottage doesn’t deter these haters from opining? It is only comical in the end.
Erm, not everyone here is an auslander realtor who kisses rich people’s behinds for a living.
Again you don’t know what you’re talking about whatsoever. Not about me I guess, although that’s nowhere near an apt dis of my acumen, and also not about this particular row of homes and especially given what it had been previously.
Give inflation, to break even the owner would have to sell for $7.02M, so she actually lost about $350k on the deal or about 5%
While the industry likes to conflate asset appreciation with profit, don’t neglect holding and transaction costs when calculating a break even point or returns.
Or the cost of renting a comparable place.
And if, instead of this ridiculous mansion, someone had to wanted to turn this into six 800-sqft condos, that would be prohibited by the RH-1 zoning. This is a policy failure.
Indeed. It is a ridiculous mansion. If you are going to go as big as this, you ought to be building for more than one or maybe two people.
I dream of one day owning a house like this.