Purchased for $3.525 million in April of 2017, the “ultra-swanky entertainer’s showplace” home at 389 27th Street returned to the market priced at $3.75 million this past November, a sale at which would have represented net appreciation of just 6.4 percent since the second quarter of 2017.
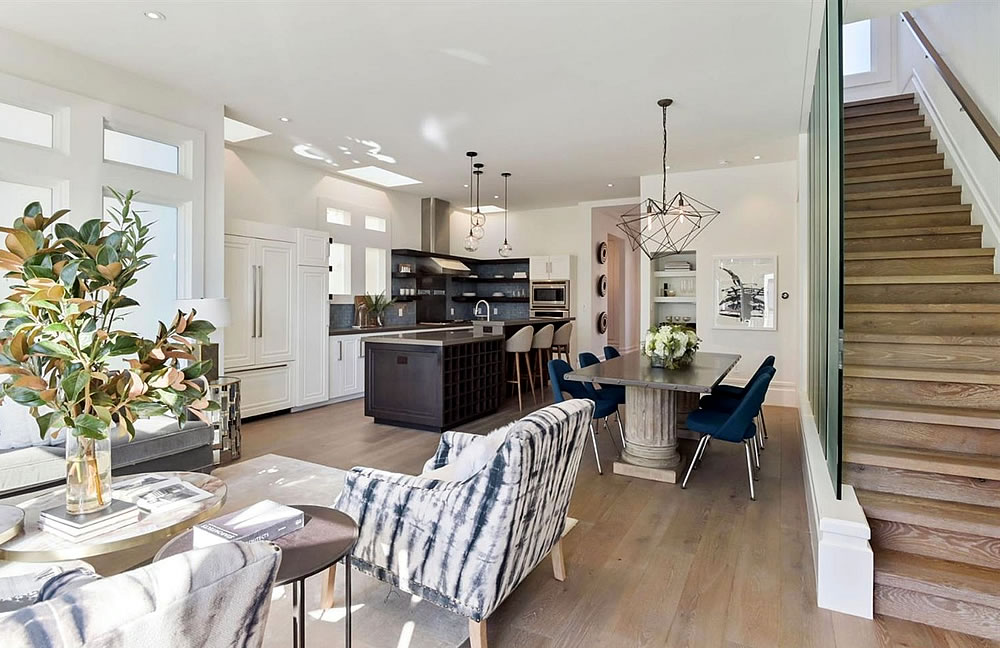
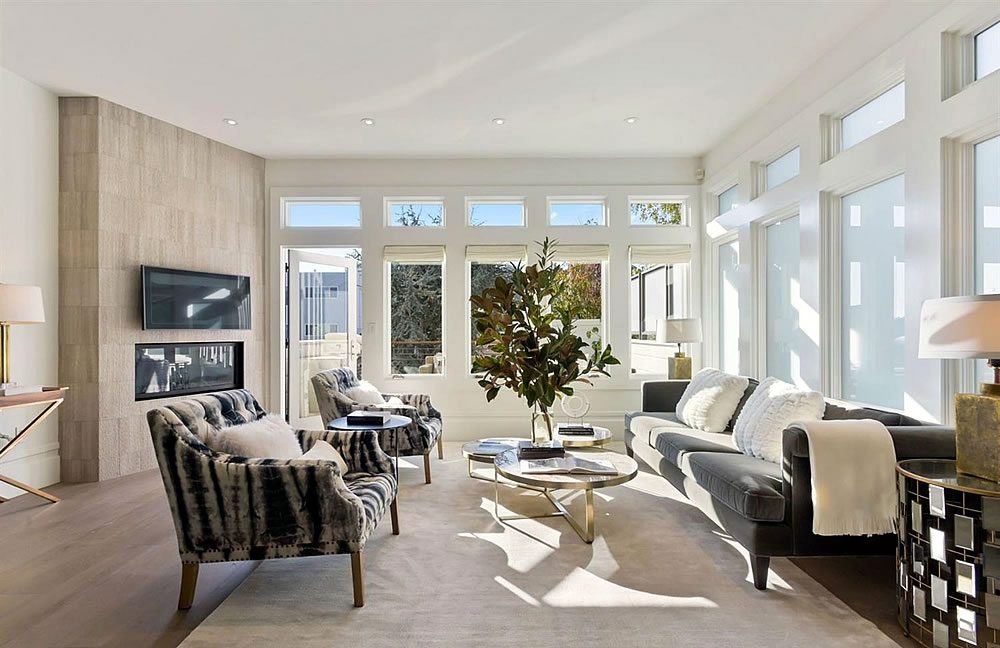
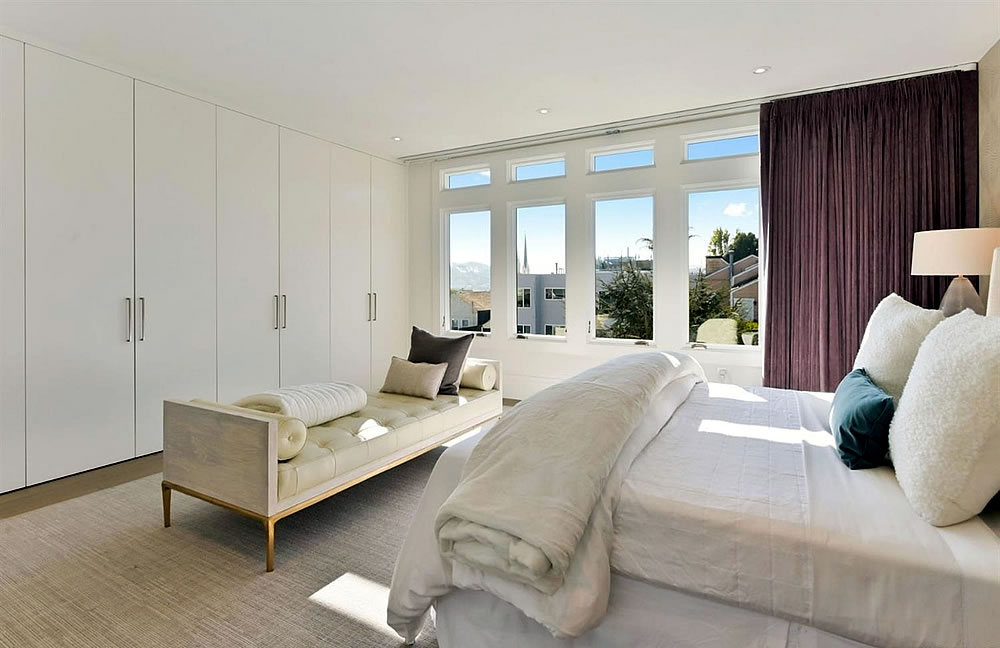
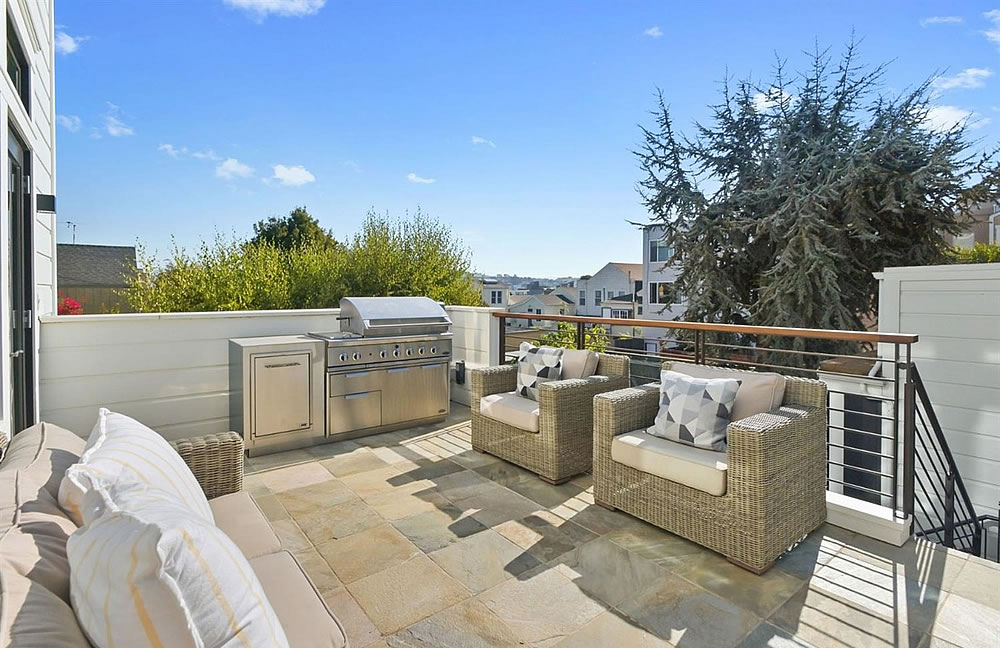
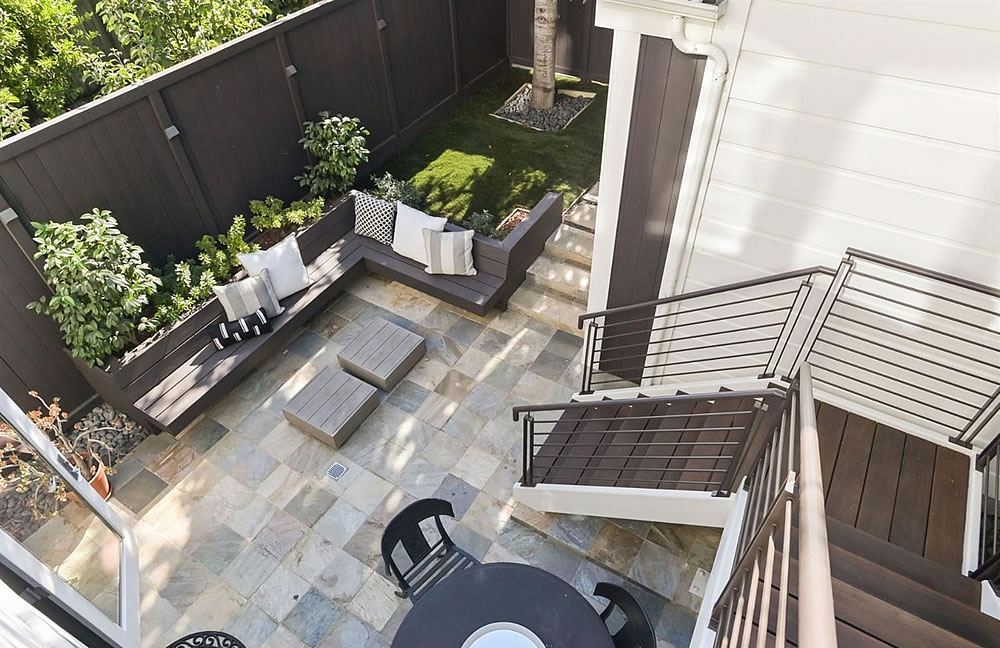
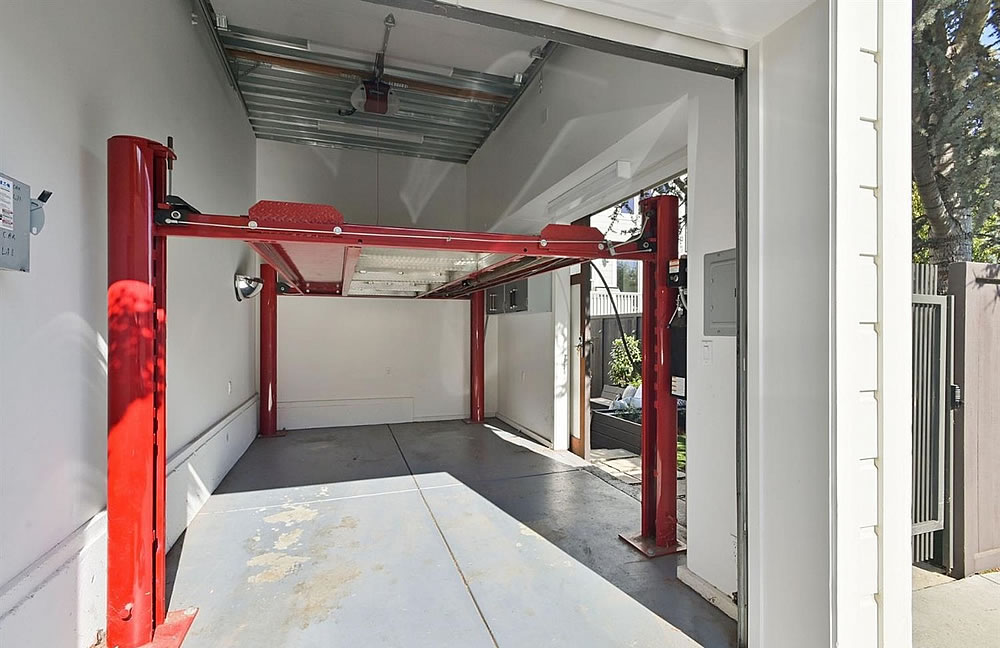
Hidden behind a restored Victorian façade, the 2,930-square-foot, light-filled Noe Valley home features an open concept main floor, but with a distinct family room and home office as well, along with three (plus) bedrooms, a stacked two-car garage (and additional parking spot), and “glorious outdoor space” (including a rear deck off the living room with a plumbed grill).
And the resale of 389 27th Street has just quietly closed escrow with a contract price of $3.500 million, down 0.7 percent from the second quarter of 2017 on apples-to-apples basis while the Bay Area index for single-family home values was up 21.1 percent over the same period of time and the “median sale price” was up as well.
This is probably the hardest hit category of home, moreso even than the small condo in a tower in SOMA.
Families where the parents worked in SF were willing to deal with the headaches of raising kids in SF because they wanted a reasonable commute. Now, all except the most ardent urban dwellers will move to places like Orinda with better schools, better weather, more space, etc and make the trek into SF 2-3 days a week.
Except there are people living in Orinda. Looking out my window I don’t see a lot of for-sale signs…well maybe the Airbnb murder house but only so many people you can fit in there (that’s how it became the “murder house”)
You think a 3+Br 3.5Bath with parking a deck and private back patio space in a nice low crime area such as Noe is in the hardest hit category of homes? That seems almost 180 deg from what I see.
I do see a number of families with kids are leaving SF, but for those who stay this seems like the type of home they want/need. Sharing bedrooms/baths, street parking in a time of increasing property crime, transitional neighborhoods which are starting to backslide all seem like factors which are hitting other homes much harder.
The main bedroom on a separate floor issue can go either way with people. Having a space for a nursery on the main bedroom floor hits the case that most people care about.
I’m talking long term (10-30 years) not what you’re seeing right now. With work from home, families have less and less incentive to stay in SF. Young people still have incentives to stay in SF (dating, partying) so I’m less worried about the SOMA condo.
I’ve been here for 23 years and I don’t recall there ever being any incentives for families to stay in SF? That’s why, at least since before the 80’s, families got started here and moved out when the kids got to school age. “more dogs than kids” isn’t new. But agree with some other comments; if one were to stay in the City and couldn’t afford Presidio Heights or something, this is a pretty nice location and option.
I agree except having an office space seems more important than all kids in separate bedrooms (2 of my 3 boys chose to share a bedroom when we moved from SF condo to SF SFR, which gives me a large office).
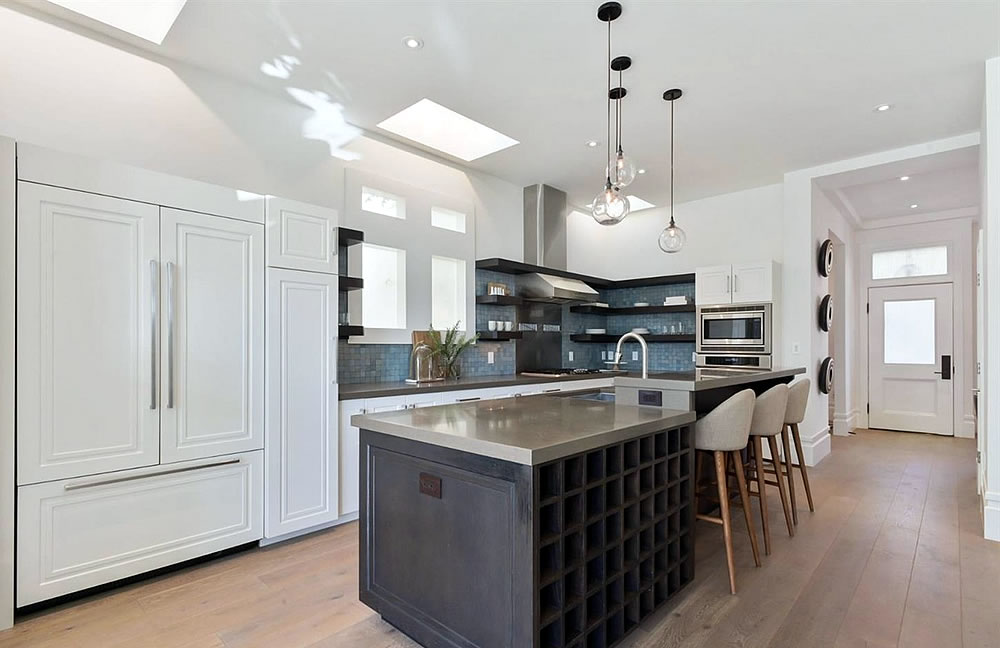
Completely un-temperature-controlled storage for 54 bottles of wine is not a good use of space.
Two issues with this house for a family: 1) floor plan – doesn’t have 3/2 on the same floor that families with younger children want; 2) garage – doesn’t actually fit anything larger than a 3 series (and even that is very tight) with the lift installed.
I love how every house discussed on this website has MAJOR PROBLEMS, according to the commentators.
Only houses that sell for a loss.
Everything else is hot!hot!hot! :-p
Except that those were issues back in 2017 when it took 3 months to sell in a very strong market, even after enduring a price cut. And it still sold for under the reduced price back then. But, sure, this house didn’t and doesn’t have MAJOR issues that make it less desirable for at least a portion of the buyer market in Noe…
I agree. We ruled out many homes with bedrooms split across 3 floors (and one place with a too narrow garage). Maybe it works ok if your kids are all 10+
So it sold for basically the same price as the red hot 2017 market. OK. Huh. And here I thought it was armageddion time like Joe Strummer said …
Well, if you were led to believe that local values were actually trending up, rather than down, a 2017-era sale price might feel like “armageddion time” to some.
No it is basically the same high price. You perpetuate a fallacy that everyone banks upon appreciation on here for some reason. Also, there was no need for you to address me there. Who you address and who you do not remains a pitifully weak suit for you, editorially.
Well, 2017 is height of the market. Yes, if you bought a place in 2017 (or in 2018 or 2019 which are slightly softer market than 2017), you probably lost money. The fact it sold for 2017 price is indicator that the market is coming back.
Interest rates are another variable that nobody has brought up. You’d be paying 1.25-1.5% more on a jumbo loan in 2017 than right now. Even though it is roughly the same price it is a LOT less of a monthly mortgage payment to buy in 2021 and don’t say that nobody borrows to buy a house at this price point (people do).
Good point. Mortgage rates are a not so obvious home price influence.
The mortgage affordability phenomenon caused the 2008-ish run up in prices and resulting crash. The same factor is still in play.
I would not recommend this property because the 2 bedrooms in lower level have a subterranean feel. I did not see the property FWIW.
If this sold for 3.5 then I feel even more strongly that 313 Duncan will sell in the 3’s! This is a nice house (except with no cool cottage). Bedrooms on the first floor perfect for families with older kids really. They and their friends (once covid is over?) can do their thing down there with the rec room and not bother the adults. Subterranean feel a plus, TBH, they’re all on their screens now anyways.
A lot of doom and gloom when cherry picking “apples to apples.” 10 Mercato Ct recently sold for $450k more than when sold about a year ago at the end of 2019. Yes, the previous owner made some upgrades. I live nearby and the 2-3 other “apples to apples” have all appreciated over 2017, perhaps by not as much as the wider Bay Area.
While a popular narrative and rationalization, we don’t “cherry pick” the apples we feature on the site. In fact, we typically won’t feature a sale if we know its outcome prior to it being placed in our cart. And in the rare case that we do know the outcome prior, we’ll note it in the copy.
At the same time, we’re always looking for valid sale pairs, but beyond the nebulous “many others” or properties that were actually upgraded or modified between sales.
Thanks for the reply. I could be mistaken, but it seems like the implied conclusion from this article is that the SF home market is not as “hot” compared to the rest of the Bay Area, based on the 2021 sales price of this home compared to 2017. This seems specious, given that we are comparing one “apples to apples” example in SF vs. Case-Schiller or some other index for the Bay Area.
How do you select which properties to feature for these “apple to apples” comparisons?
A week ago a poster, “asdf” linked to an attempt on their part to apply the Case-Schiller methodology at a more granular level to neighborhoods in NYC. By the looks of their data they found neighborhoods ranging from -27% to +18% YoY performance. This seems to dovetail with anecdotes of different areas following very different price trajectories during the pandemic. But as I point out on that thread there is a trade-off between reduced statistical significance due to smaller data set size and better capturing a sub market by not lumping markets going in different directions together.
My feel is that yes, SF is doing worse than the rest of the Bay Area. But this type of property (SFH, higher Bd/Br count, garage, private outdoor space, safe neighborhood,..) is probably among the best performing in SF.
But as we noted at the time, with respect to said attempt:
“We sincerely appreciate the approach and applaud the output and additional market insight.
But…[said attempt] doesn’t differentiate between movements in the market and changes in value due to properties being “remodeled or otherwise improved” between sales, which can be particularly acute in neighborhoods that are gentrifying and/or have a higher percentage of older housing stock and fails to yield true “apples-to-apples” sale pairs and a resultant index.”
FWIW, Compass Reports has Noe (grouped with Eureka, Cole Valley, Corona Heights) as one of the lowest areas of SF in terms of % listings accepting offers in Q4 2020. This grouping also has one of the lowest ratios of Sales Price to Original Price across SF. I am not saying these are perfect metrics, just an observation.
I agree with the “Garbage In Garbage Out” (GIGO) issue. The input data has to be clean for any process to work.
But beyond that, when you break data down into groups and get this large 45% [-27%/+18%] spread between groups that large spread is part signal and part noise. The signal part is telling you that there is actually that much of a spread between groups. The noise part is telling you how much statistical significance you have. Most likely due to either bad input data or an insufficiently large data set.
Hard to say which without someone doing the actual math for the error analysis. NYC is about 10x the size of SF, don’t know how the number of RE transactions compares but I’d guess that if it’s hard to make the stats work for NYC it’ll be even harder for SF.
This isn’t a matter of garbage data, it’s actually extra clean. But while based on sale pairs, which is a nice approach, it’s not actually “apples-to-apples” as it doesn’t account for the value of any improvements, additional investment or changes to a property between sales.
That being said, there’s value to the analysis if you understand what it represents (and what it does not).