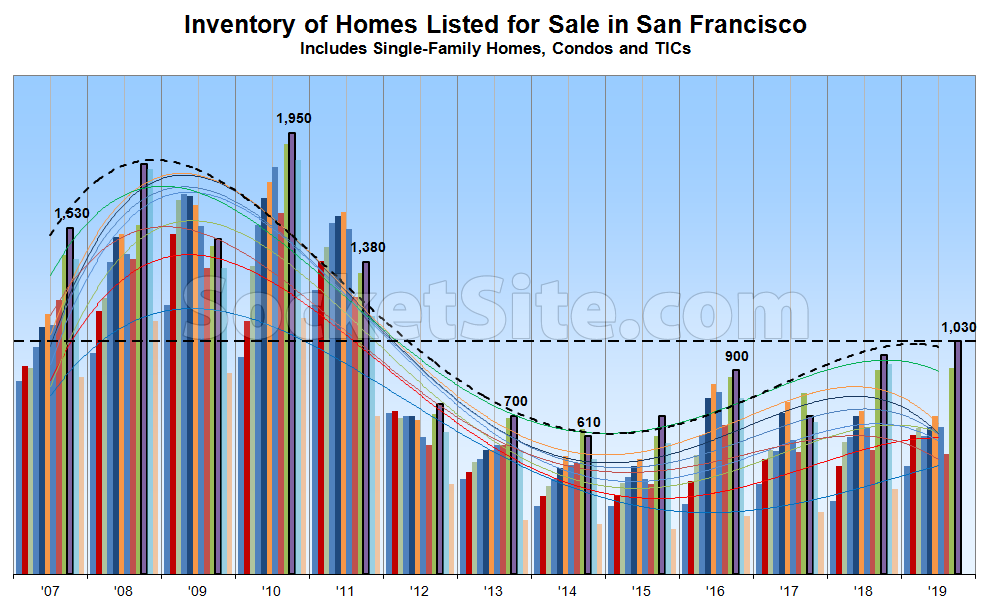
Having hit an 8-year high last month, the number of homes on the market in San Francisco has since ticked up another 5 percent to 1,030, which is 6 percent higher than at the same time last year.
While the year-over-year gain in inventory levels is still being driven by listings for condos (690), which are currently up 11 percent on a year-over-year basis, not including the vast majority of new construction condos for sale across the city, the standing inventory of single-family homes on the market has been ticking up and currently totals 340 (which is within 3 percent of its mark at the same time last year).
And the percentage of active listings which have undergone at least one price reduction has ticked up to 20 percent while the percentage of homes on the market with a price tag of a million dollars or less is holding at 27 percent (which is down 6 percentage points versus the same time last year, increasing the share of more expensive listings and resultant sales).
If typical patterns hold, inventory levels have likely peaked for the year. That being said, with year-to-date home sales in San Francisco running at an 8-year low, and an early October bump in pending home sales activity having already petered out, inventory levels could still tick up a point or two before dropping through December.
Can you please clarify what the wavy lines represent?
The columns represent consistent, point-in-time measures of inventory levels for each month of the year. Each line represents the trend in inventory levels by month (January to January, February to February, etc), with the dotted line being the current trend (and level) at hand.
it represents the editor’s lack of understanding of trend lines and trying to fit a polynomial spline for our apparent reason. where a moving average would do. seriously Socketsite: you do this every time you post this figure and it never makes sense
No kidding! Can you imagine being led to believe that inventory levels have actually been trending up since 2015, perhaps even headed to an 8-year high?
Let’s see if the higher inventory leads to higher sales, which will be informative as to the level of demand — does higher inventory mean that homes are languishing due to low demand, or simply that more people listed, but they are getting bought up? A few omissions and fallacies in here should also be corrected. The editor notes that 20% of listings have undergone at least one reduction but fails to mention that, as stated in his post a year ago, “23 percent of the active listings in San Francisco have undergone at least one price reduction.” Also, he states that the 6% year-to-year increase in $1 million+ listings has increased “the share of more expensive listings.” Not necessarily. It could simply indicate that prices have risen, and last year’s $950,000 listing is this year’s $1 million listing. He further states that the 6% increase in $1 million+ listings will increase the resultant share of sales of “more expensive listings.” Of course, we cannot know that until we see what sold. It could be that a disproportionate number of the lower-priced listings end up selling. It would take an analysis of sales vs. listings to draw any conclusion about the “mix.”
Listing and sales volume are informative, but they don’t tell us a whole lot about prices (listing/sales volume in Pacific Heights is very low, yet prices there are very high). Case Shiller numbers, median SF sales prices (12-month average rather than monthly figures, which have more noise), and $/sf figures will tell us where prices are.
Unlike those that conflate the gross number of homes listed for sale in a month with inventory levels, our numbers are net of sales. In other words, inventory levels go up when new listings (supply) outpace sales (demand), and vice versa.
As we noted last month, while the percentage of listings with a price cut is ticking up, as expected, the year-over-year comparison in reductions is currently being skewed by a growing number of unsold properties having been relisted anew with a reduced asking price, but no official reductions according to MLS-based stats.
And with respect to the impact of “mix,” the current trend is actually the opposite of what you’re suggesting, with the relative share of “luxury” sales increasing, but still down on an absolute basis, and “mixing” the median sale price and average price per square foot figures up. But we’ll agree, Case-Shiller is rather telling.
Days on market is also useful information. Palo Alto is up 62% from last year. San Francisco up 116% from last year.
“our numbers are net of sales” What in the world does that mean? You’re counting only inventory that is not yet in contract? Something else?
Yes, when listings outpace sales (“sales” does not equal “demand”), inventory levels go up. But inventory levels also go up when a lot of new listings come on the market in a short period (as happened in September), and they go down as that inventory gets sold. That’s why you need to look at both inventory and sales numbers together, over time. Inventory levels alone (even “net of sales” whatever you define that to mean) tell you little to nothing. And, of course, the best metric for price trends is price data, like, as you note, Case Shiller sitting at a record high. We’ll see if that holds.
If only we had some idea of the trend in sales, both year-to-date and currently (see above), and looked at the year-over-year trend in inventory levels to account for seasonal variability in both listing and sales patterns (again, see above).
You’re dead wrong with respect to the import of inventory levels. And yes, we do exclude all properties which are in contract from our inventory counts.
Agree DOM is a useful metric. SF went from 25 DOM to 28 year over year for houses in September. From 28 to 35 for condos. Definitely slowing, but still a hot market. And certainly not 116% higher. Where did you get that?
You’re using the “days since the current listing was added” which allows agents to play games by taking properties on and off the market to reset days on market.
To avoid that, I use total days a currently listed property has on the market since it was first added, less any gaps while it was off the market. Condos are up more than SFRs but true DOM even for SFRs is up 94%. The absolute numbers are still quite low (a little over a month for SFRs), but the numbers have been trending sharply higher this year compared to the prior year.
Yeah, you’re personally tracking all that, and I have a bridge I’ll sell you. Regardless, even with your hundreds of hours of data reconciliations, you and I agree that “The absolute numbers are still quite low (a little over a month for SFRs).” Quite low indeed. So we went from a rapidly boiling market to just a hot market. Fair enough.
Yes, a “hot market” in which inventory has ticked up to an 8-year high, sales have dropped to an 8-year low, apples-to-apples losses are growing and indexed returns for the greater Bay Area, which have been boosted by the performance of lower-cost areas, are approaching negative territory with the middle of the market, the bucket into which the majority of San Francisco home sales would actually fall, having peaked…over a year ago.
Correct, we’ve gone from an absolutely on fire market over several years to a merely hot market today. That is why relative terms such as “8-year high” really don’t mean a whole lot (last season the Warriors lost the most games in six years (!!!) But they were still quite hot). The tell in your post is your phrase “approaching negative territory,” which means, in plain English, currently still in positive territory. Hence, a still hot market, although clearly not as hot as a few years ago. Don’t worry, some day, maybe soon, the assertions you’ve been repeating for about three years that the downturn is upon us will actually be true.
An indexed average return of 0.2 percent over the past year – and that’s having been boosted by the performance of lower-cost areas and compared to a national average of 3.2 percent – is “hot?” Yikes.
Regardless, for those now hanging their hats on the Case-Shiller index, the middle of the market, the bucket into which the majority of San Francisco home sales would actually fall, actually peaked over a year ago.
And no, the slowdown/downturn/pullback/cooling/whinging didn’t start three years ago. It was more like four.
Speaking of Case-Shiller: Indexed Appreciation for Bay Area Homes Turns Negative.
This tools in use here render a space incapable of appreciating a hot market contemporaneously. Mix in the biased language, pooh poohing all things at all times. But ultimately at best it’s, “oh was that year a hot year? ho hum indeed it was,” in hindsight. This year has been fine year. Down a bit in volume from 2018, but up in price over an all time peak year.
Negative market territory! What’s price at?
163 25th Avenue just traded for $1,288psf. Not shabby for a pitched roof house on a busy street in the Outer Richmond. (Hot trendspotter for high value: plastic hot tub).
The amazing but thrashed Brugnara property at 224 Sea Cliff is on the market at $15mm. It’s a bankruptcy sale this time, and the contract price will be subject to overbid. How many people do you know in the city who can walk out of their house, and down a private stairway to the Pacific Ocean? I’m pretty sure that neighbor Tom Steyer, (who has enough money to buy himself a place at the Democrat Debate), can’t even do that from either of his Sea Cliff homes. I sure hope/don’t hope they re-paint the pepto Bismol color. It’s mad distinctive, even from Marin.
Maybe add some rusty dinosaurs on the cliff. What’s the name of the crazy lady who bought the Flintstone house in Hillsborough or wherever? She needs this one too.