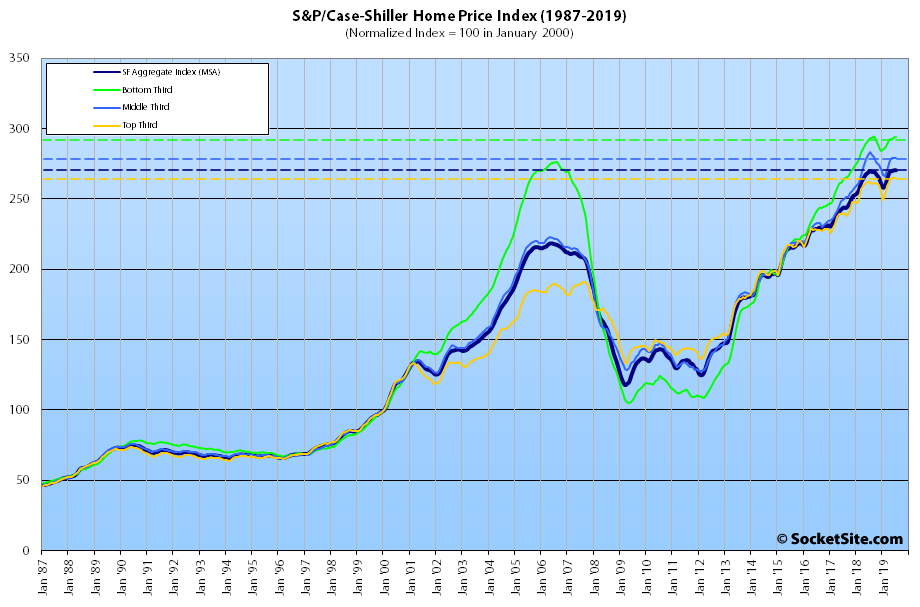
Having eked out a 0.2 percent gain in June, the S&P CoreLogic Case-Shiller Index for single-family home values within the San Francisco Metropolitan Area – which includes the East Bay, North Bay and Peninsula – was flat in July.
And as such, the index is now up a total of 0.2 percent over the past year, which is the smallest year-over-year gain since the second quarter of 2012 and down from a 10.7 percent year-over-year return at the same time last year despite a dramatic drop in mortgage rates and plenty of IPO related hype over the past two quarters.
At a more granular level, the index for the bottom third of the market inched up 0.1 percent in July for a total year-over-year gain of 0.3 percent (versus a year-over-year gain of 11.0 percent at the same time last year); the index for the middle third of the market slipped 0.1 percent and is now down 1.5 percent on a year-over-year basis, which was the second year-over-year drop for the middle tier since the second quarter of 2012; and the index for the top third of the market slipped 0.2 percent for a year-over-year gain of 0.9 percent (versus a year-over-year gain of 9.4 percent at the same time last year).
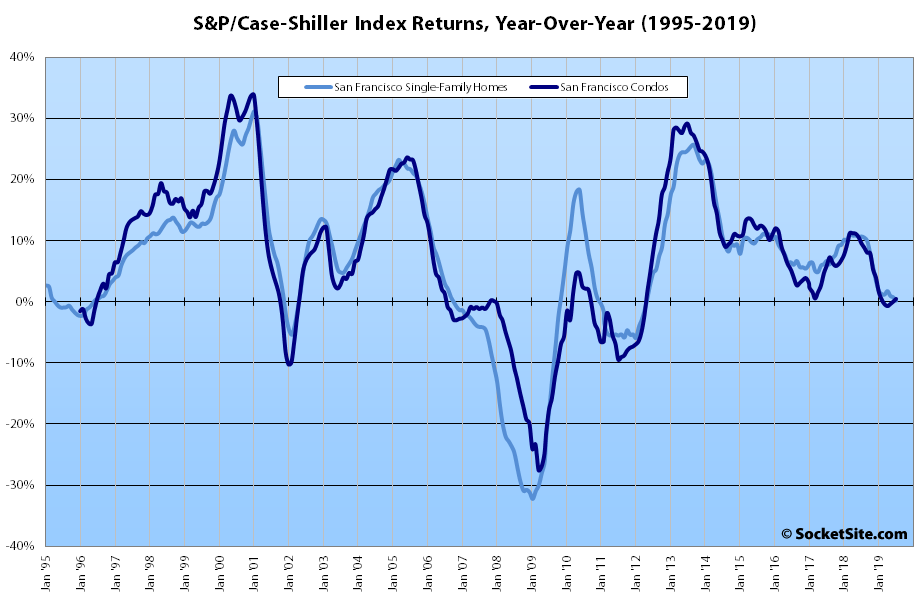
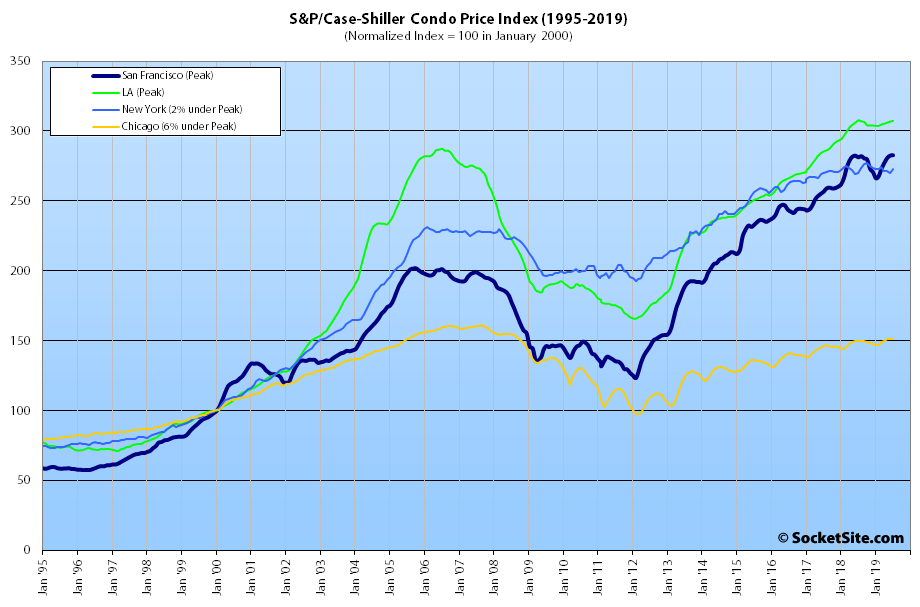
Having inched up 0.1 percent in July, the index for Bay Area condo values managed to eke out a year-over-year gain of 0.5 percent, nominally higher than the year-over-year gain for single-family homes.
Nationally, Phoenix is still leading the way in terms of home price gains, up 5.8 percent on a year-over-year basis, followed by Las Vegas (up 4.7 percent) and now Charlotte (up 4.6 percent) with Tampa having dropped into fourth place with a 4.5 percent gain.
And for the second month in a row, San Francisco ranked next to last in terms of year-over-year gains for the top 20 metropolitan areas in nation, above only Seattle (which was down 0.6 percent) and versus a national average of 3.2 percent.
Our standard SocketSite S&P/Case-Shiller footnote: The S&P/Case-Shiller home price indices include San Francisco, San Mateo, Marin, Contra Costa and Alameda in the “San Francisco” index (i.e., greater MSA) and are imperfect in factoring out changes in property values due to improvements versus appreciation (although they try their best).