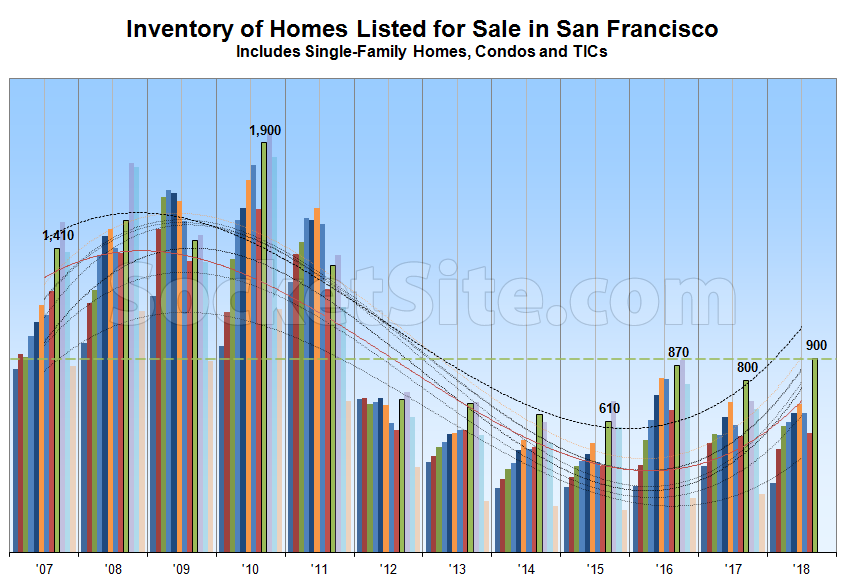
Following a trend which shouldn’t catch any plugged-in readers by surprise, the number of homes actively listed for sale in the San Francisco (900) has just hit a 7-year high and is now running 12 percent higher on a year-over-year basis and 30 percent above its mark at the same time in 2015 (690), the year which remains an inflection point for the current cycle.
At a more granular level, the number of single-family homes currently listed for sale in the city (360) is now running 34 percent higher versus the same time last year while the number of listed condominiums (540) is up 1 percent, not including the vast majority of new construction condos for sale across the city, the inventory of which has been hovering around 500.
In terms of pricing and expectations, 14 percent of the active listings in San Francisco have undergone at least one price reduction, which is even with the same time last year, while 34 percent of the homes on the market are currently listed for under a million dollars, which is even on a year-over-year basis as well.
If typical patterns hold, expect inventory levels to continue to climb through the end of September or mid-October. And once again, keep in mind that recorded home sales in San Francisco dropped to a seven-year seasonal low in July.

Is there historical data on average price per square foot? Would be a useful complement to the data on % reduced, % under $1M, etc.
Something I wondered about as well.
Would be interesting to see days on the market as well; sellers may ask for the moon, but when the house just sits without any offers there should be more price reductions and you may actually see the average prices decline.
What is the typical percentage of housing units for sale in a “normal,” “healthy” real estate market? Depends on building mix, I know, urban vs. suburban, etc, but isn’t it close to 5%? If someone knows off the top of their head, would be interesting. It’s not easily Googled.
5% sounds a bit high to me, but I have not seen a number for this. Somebody posted on this site that the average home is traded every 7 years – not sure if that is a Bay Area number (I would have thought that it would be somewhere between 10 and 15) but if you use the 7-year average ownership and 60 days on the market you arrive at 2.4% of the homes on the market at any given time.
It’s only going to continue to rise. With rising interest rates, foreign investment drying up, less tax advantage to own, ridiculous sky high tech valuations coming down, and the continued specter of a trade war, it seems like smart investors are trying to get out while they still can.
Anecdotal, city of San Mateo. Talked to a realtor yesterday, and the recently white-hot 1.5m to 2m market has cooled a bit. A few months ago, she said houses would list for 10 days and get 5 or 6 good offers. Now they “sit” for 20 days and get only 1 or 2 good offers.
From yesterday, Bay Area’s runaway housing market taps the brakes. Will the lull last?, first two ‘graphs:
Emphasis added. I’m not saying this is a trend, only time will tell.
So still less than half as many homes as were for sale in 2010, right?
You mean near the nadir of the market and as charted above? That’s correct!
CAR August report highlights San Francisco median price is down 6% MoM. That’s a big drop. It will be fun to watch all the people who kept saying “San Francisco home prices can never go down” for the past six years start to backpedal on their predictions.
Yes, but up 12.3% year to year. Lies, damned lies, and statistics. I’ve never heard anyone say “San Francisco home prices can never go down,” and after the 2008-2012 experience, that would be a rather silly thing to say. But I agree with you that anyone who says that will be proven wrong (again) at some point.
“Lies, damned lies, and statistics.”
In terms of those continuing to confuse/misrepresent changes in the median sale price with changes in values? Unfortunately, that’s certainly true! In the meantime, while inventory levels in San Francisco proper have hit a 7-year high, sales recently dropped to a seven-year low.
How much have prices dropped over that 7-year period?
Can you please tell me the source of your data for the chart “Inventory of Homes For Sale in San Francisco”? And/or the geographic area it includes – SF Metro, SF County, City of SF? I am broker in Chicago doing research on housing market trends. The count of Active listings/Homes For Sale is different on various sites: Redfin, Zillow, and SFAR-MLS brokerage sites. It’s not a big deal, but it’s always interesting to see data on different markets, right? Thanks. PS: Nice chart!