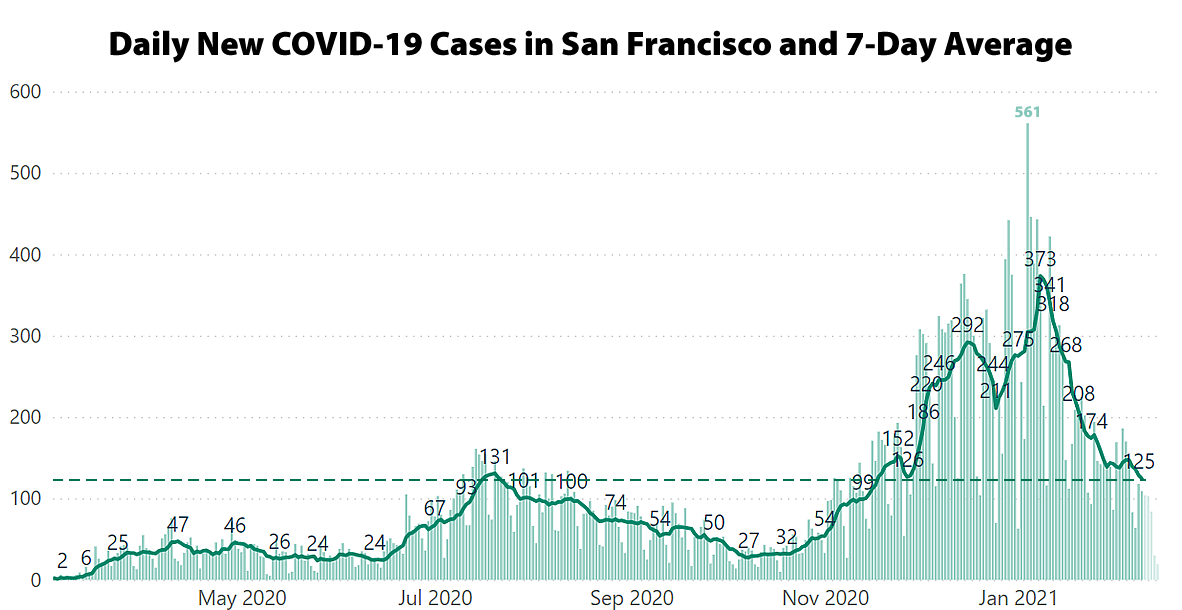
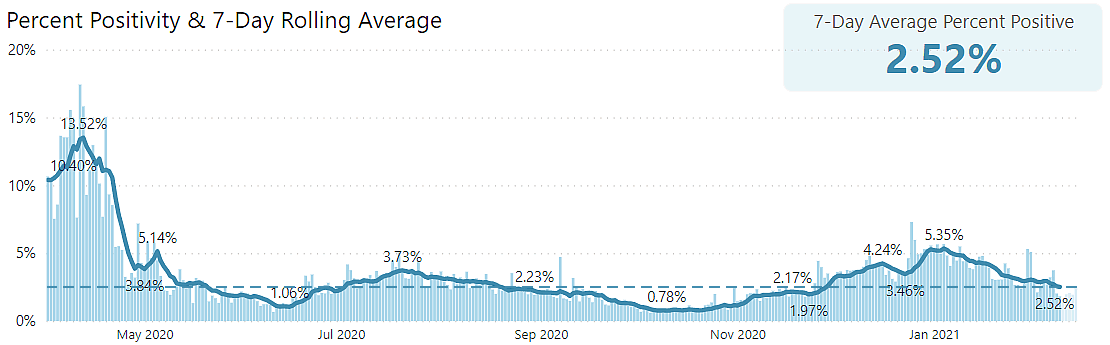
Having hit a revised pandemic high of 373 on January 8, the 7-day average number of daily new COVID-19 cases diagnosed in San Francisco has dropped to 125, which is the lowest 7-day average since mid-November, 2020, and just below the local peak rate in July, with a percent positive rate for those who are tested having dropped to around 2.5 percent.
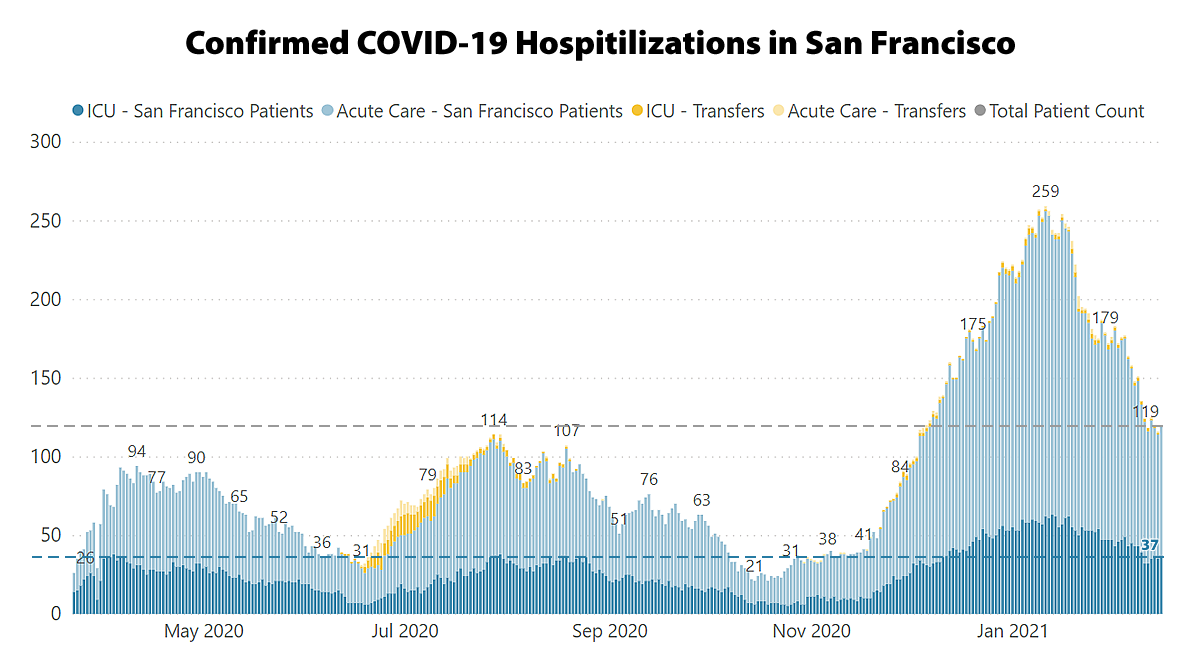
At the same time, local hospitalizations have dropped as well, but there are still around 120 local hospital beds occupied by COVID-19 patients and at least 37 people in an ICU.
And with the adjusted average COVID-19 case rate for San Francisco, which takes into account testing rates, having dropped to 8.9 new cases per 100,000 residents per day, the city is closing in on the breakpoint between the State’s “Purple” and “Red” tiers of risk, which will allow for more business reopenings and other activities when the adjusted daily case rate drops to 7.0 per the State’s Blueprint for a Safer Economy and then again when the adjusted case rate drops to 4.0.
UPDATE (2/18): And in terms of when San Francisco could drop to the less restrictive Red tier, the adjusted case rate for San Francisco should drop below 7.0 within the next 5 days if the underlying case rate and testing trends hold.
UPDATE (2/19): Based on our projections, San Francisco should qualify for “Red” tier status this weekend.
UPDATE (2/23): San Francisco Officially Qualifies for “Red” Tier Assignment.
So keep it up (and down).
Bay area residents have been doing really well at wearing masks in public, even outdoors. I’m not sure what caused the winter surge, perhaps holiday travel and gatherings. But in general the Bay Area as done better than the rest of the state and country. Congrats!
This weekend I came across one weird group in Santa Cruz on Valentine’s day: A group of unmasked people with “free hugs” signs cajoling the crowd to “not be afraid” and go back to normal. Any other time this would be just Santa Cruz Happy in play but this time it was the dark side of the city (or perhaps the mountains). The next day a news story was broadcast with the same group barging into downtown SC’s Trader Joe’s without masks in some sort of protest statement.
The winter caused the winter surge of course.
Considering the peak occurred just after the beginning of winter I guess it is better characterized as a fall surge. And here we are in the middle of winter and cases are falling.
Come on MSOD, certainly one as dependent on the cold as you knows that while the virus does best in extremes of temperature, it the ‘conditions’ of winter – the cold and rain that drives people inside – that’s relevant (even is California, tho less so normally and even less so in a drought).
As such, “meteorological winter” – Dec, Jan, Feb – is more relevant than (the commonplace) astronomical winter; it’s almost over, and it tracked quite closely.
Basic epidemiology as related to Winter is the likely cause of the surge. Likely very low correlation to “doing really well wearing masks in public, even outdoors” as the virus spreads primarily indoors. Basic science eludes our elected officials and public health officials and this entire situation has been so highly politicized. The hypocrisy and complete subjective decision making on what is shutdown or not just goes to show how these people are corrupt and/or unintelligent.
The numbers provide conclusive evidence the lockdowns don’t work. Cases spiked during peak lockdown due to families and friends gathering indoors during the holidays and have fallen dramatically since lockdowns have eased. The outcome would have been far better if gatherings were allowed to take place at outdoor dining venues.
Surely you understand that party gatherings larger than nuclear families is what doesn’t work as far as preventing covid. Had there been no lockdown, plus relaxed language regarding group gatherings, then what?
Then possibly many of those social gatherings could have taken place at restaurants’ outdoor spaces and fewer would have been affected. On the other hand, with the spread concentrated in low-income neighborhoods it might not have mattered much. Would have mattered to the restaurants, though.
I don’t know where to start with someone who thinks this is conclusive evidence. Will try to come back later when I have time.
Of horse…er course, s/he put the cart before Old Dobbin: rising cases – that thing that ‘spikes’ – was what led to “peak lockdown”, NOT the other way around. but, hey, they all sorta ’round the same time, right?
(And you might come back w/a JD in tow…seems like copyright infringement in the names IMHO)
Don’t bother to feed the trolls.
UPDATE: And in terms of when San Francisco could drop to the less restrictive Red tier, the adjusted case rate for San Francisco should drop below 7.0 within the next 5 days if the underlying case rate and testing trends hold.
UPDATE: Based on our projections, San Francisco should qualify for “Red” tier status this weekend.
woohoo! open the elementary schools!!!
Elementary schools should open, if not for our dysfunctional public school system. Despite what you might heard from the news, they are still telling us parents they have no idea when is this going to open.
I was very excited and told my wife and friends (the two aren’t mutually exclusive) “SocketSite predicts we’ll be in Red next week. Sadly, still in purple at an adjusted 8.9% case rate (14.7% unadjusted), and we need <=7.
The adjusted case rate for San Francisco has, in fact, dropped under 7.0 (as predicted and which should be announced this afternoon).
But, while that QUALIFIES San Francisco to move from Purple to Red, once a County qualifies for a less restrictive tier assignment, it must maintain or improve its adjusted case rate for two weeks before it’s reassigned.
And as just announced by the State, San Francisco’s adjusted case rate has dropped to 5.2, which qualifies the County for a less restrictive “Red” tier assignment.