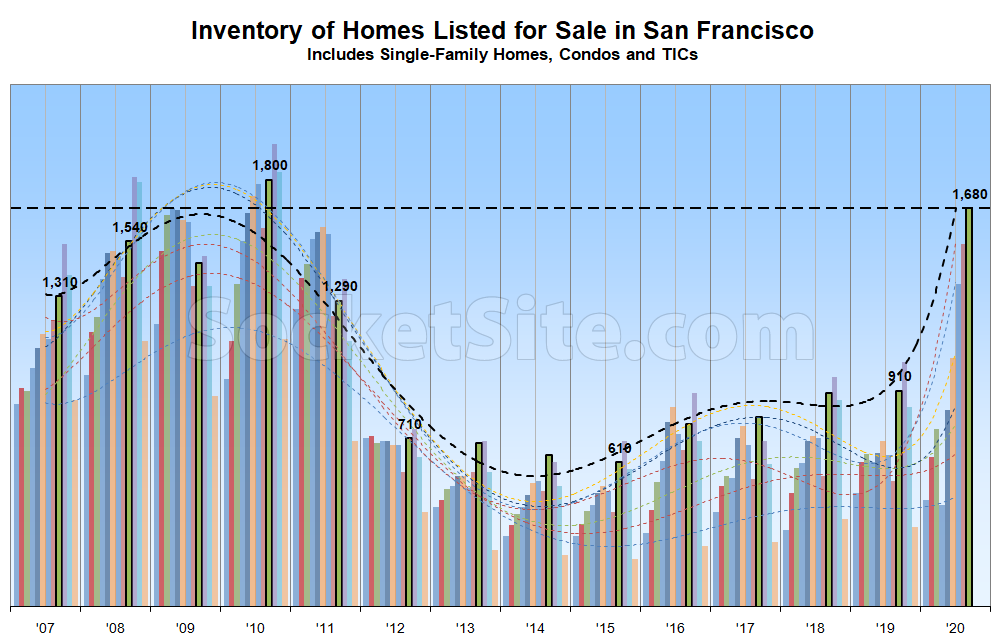
The number of homes on the market in San Francisco, net of new sales and contract activity, ticked up another 5 percent over the past week to 1,680, representing 85 percent more inventory on the market than at the same last year and a new 10-year high in the absolute.
The number of condos on the market, which remains a leading indicator for the market as a whole, now totals 1,260, representing 110 percent more inventory than at the same time last year, while the number of single-family homes on the market has ticked up to 420, which is 30 percent higher on a year-over-year basis, with inventory levels poised to jump as listings which failed to sell in the spring, and were subsequently withdrawn from the MLS in the summer months, return anew.
And as we noted yesterday, the percentage of homes on the market with an asking price that has been reduced at least once has ticked up to 31 percent, which is 19 percentage points higher than at the same time last year, while the gap between the average price per square foot of the homes which are in contract, versus those which haven’t yet sold, has dramatically grown.
When is this “jump” in SFH listings expected to happen?
I’m seeing the slightest hint of softening in my SFH search, anecdotally 2 out of 15 properties I viewed over the weekend had price reductions this week. But homes that are pretty desirable still seem to be having offer dates set indicating that things are still competitive.
Single-Family Home (SFH) inventory ticked up 7 percent over the past week, representing the largest week-over-week increase in two months (and the most SFH inventory, in the absolute, since the fourth quarter of 2011), with 26 percent of all active SFH listings on the MLS have been reduced at least once (versus 11 percent at the same time last year).
I expect that the heavy smoke has impacted sellers’ ability to get homes photographed, so that has probably contributed at least somewhat to the relatively modest increase in truly new listings we’re seeing.
Not really. People are still photographing pretty much these days, even more because of the increase in listings.
Prices for SFH going up here in San Diego and at record highs.
I haven’t seen any softness for SFH in high demand neighborhoods. Where listings are staying on the market for a while are along the south and southeastern parts of the city for houses that have unrealistic list prices. Anything that had a reasonable list price seem to be moving within a month.
Usually the post-Labor Day jump are spring listings that did not sell that come back on the market. I don’t think we saw much of a typical spring season this year because of COVID, so those typical spring listings were delayed until May, and any unsold homes just stayed on the market instead of getting delisted in the summer then relisted after Labor Day.
The smoke probably prevented good sellers from getting adequate pictures for listings to an extent, but if there were anything delayed for this reason, we’ll see it come up next week most likely now that we have some clear days ahead of us.
Below 2015 pricing in the Marina at a near $9M price point.
5% below 2014 in Cow Hollow at $4M pp.
Flat to 2015 pricing in Noe at $2.8M.
I’d say its a broad retreat to 2014-2015 pricing even for high end SFRs.
Agree with the higher end market. That’s pretty consistent with the high demand in further out markets where they’re seeing a lot of people from the cities moving out there. The luxury market is generally subject to pretty dramatic swings since those are the people who can afford to move on a whim. However I wouldn’t look at higher end market sales as an indicator of a “broad retreat.”
Once you start looking in the sub-$2M range, that market is doing well and houses are moving. A lot of demand in the high demand neighborhoods that have done well in the past 5-ish years (Bernal, Sunnyside, Glen Canyon, Sunset, etc.). Even Portola and Visitacion Valley has seen consistent sales activity. These neighborhoods are still far above 2014-2015 pricing.
We’ll see. Watching this one in GP dropping its list into 2015 range. $2.1M in 2015, Started asking $2.4 early august, just dropped to $2.3M (10% over 2015).
No priors on this one in West Portal, but sub $2M been sitting for 6 weeks and just dropped the price.
Good data points. Seems like the softening is working its way down market. Wonder when we’ll see demand on the lower end dry up from people looking to move out of apartments and condos. Those seem to be driving a lot of the sales in southeast and southern SF neighborhoods where it’s more affordable. Of course houses with incurable defects like bad floor plans aren’t moving, but anything half decent will still sell as long as list price is still reasonable.
Reasonably priced and affordable homes were still moving in San Francisco at the height of the great recession, but for 10-45 percent less, or around 20 percent less on average, than before.
The average sale price per square foot for sub-$2M homes is down over the past six months and year-over-year. At the same time, the quality of said sub-$2M homes is ticking up with higher-end market declines.
This doesn’t include many properties that are for sale off-market (not in MLS)…
That’s correct. But the number of “off market” properties is nominal compared to listed inventory.
Please justify that the number of off-market properties is nominal.
Do you have a concrete reason to believe they’re not?
Please justify the use of the word “nominal” to mean what you thought it meant.
Well, socketsite used the world nominal in the context of what they meant, which is what I thought it to mean.
Regardless, Aalto is just one platform where off-market properties are listed. The amount of properties is shockingly high on just that one platform. Also, I am assuming that there are properties off-market that are not in databases as such.
Overall, one could speculate with reason that the amount of properties listed on the market is much higher than what the graph suggests.
Yes, the graph only measures the MLS. My overall point is that we’d all be shocked about the amount of properties for sale if off-market properties were listed in the MLS.