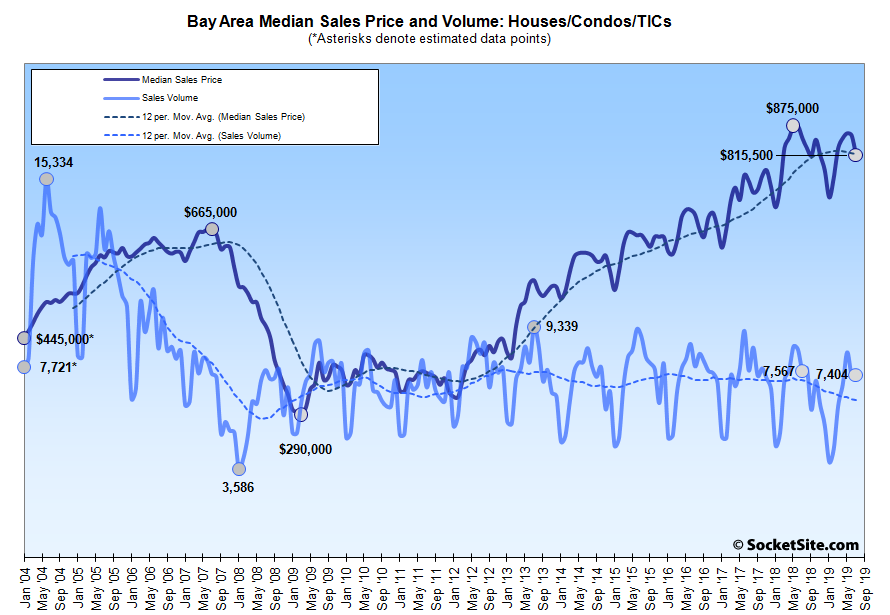
While the number of single-family homes and condos that traded hands across the greater Bay Area inched up 0.5 percent from June to just over 7,400 in July, sales were down 2.2 percent on a year-over-year basis and totaled an eight-year seasonal low, according to recorded sales data from CoreLogic.
At the same time, the median sale price for the Bay Area homes that traded hands last month dropped a mix driven 4.7 percent to $815,500, which is down 4.1 percent versus the same time last year, representing the largest year-over-year drop since the fourth quarter of 2011 and the fifth consecutive month with either a year-over-year decline or no gain.
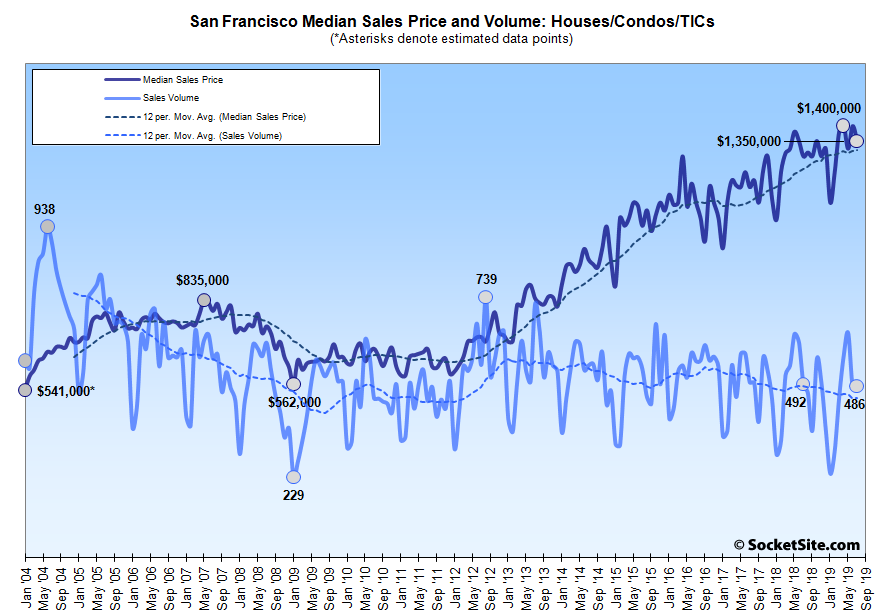
In San Francisco, while recorded sales were up 0.8 percent from June to July, total sales (486) were down 1.2 percent on a year-over-year basis, representing an 8-year seasonal low as well, which shouldn’t catch any plugged-in readers by surprise.
On the eastern side of the Bay, a total of 1,512 homes traded hands in Alameda County last month, which was down 8.0 percent on a year-over-year basis. Sales in Contra Costa County totaled 1,542, down 2.9 percent. And sales in Solano County totaled 636 in July, up 3.4 percent versus the same time last year.
Down south, home sales in Santa Clara County totaled 1,499 in July, down 7.6 percent on a year-over-year basis while sales in San Mateo County totaled 602, which was up 1.7 percent.
And up north, home sales in Napa totaled 149 in July, up 15.5 percent versus the same time last year. Sales in Sonoma came in at 636, up 7.4 percent. And sales in Marin totaled 335, up 15.5 percent as well.
With the share of more expensive home sales in the city having increased, the median price paid for those 486 homes in San Francisco was $1,350,000, down 3.4 percent from June but 3.8 percent above the median sale price at the same time last year.
The median sale price in Alameda County was an estimated $838,000 in July, down 2.0 percent versus the same time last year and the median sale price in Contra Costa County was $617,400, which was down 2.8 percent, while the median sale price in Solano County was $450,000, up 4.3 percent on a year-over-year basis.
The median sale price in Santa Clara County was $1,100,000 last month, which was unchanged versus the same time last year, while the median sale price in San Mateo County was $1,330,000 in July, down 2.8 percent, year-over-year.
The median sale price in Marin was $1,060,000 last month, down 3.6 percent versus the same time last year while the median sale price in Napa ($638,500) was down 4.6 percent and the median sale price in Sonoma ($585,000) was down 2.2 percent.
And as such, the median home sale price across the greater Bay Area was $815,500 in July, down from $850,000 at the same time last year and a peak of $875,000 in June of last year.
That being said, and as always, keep in mind that while movements in the median sale price are a great measure of what’s selling, they’re not necessarily a great measure of appreciation or changes in value and are susceptible to changes in mix, especially as sales volumes drop, as opposed to movements in the Case-Shiller Index.
A number of key factors. Chinese investment has collapsed as the government there restrict the amount of money that can be transferred out of the country. IIRC it’s now 50K. HB1 visa numbers are down and many who would have purchased aren’t here to do so. Plus there is uncertainty around those with HB1 visas and they are holding off on purchases. For investors there are ever more red flags – 7 rent control bills are working their way through Sacramento with one requiring landlords to rent to Section 8 tenants – so more residential real estate investors are cashing out of California. Population is essentially flat in the BA putting a cap on demand as millennials and over-55 individuals choose to leave the BA and California. And fewer people choose to move here BA hence the net domestic out-migration.
Its actually called an H-1B visa, and from what I have read you are incorrect, “the number of petitions for new H-1B visas totaled 201,011 this year, federal authorities announced [in April], up about 6 percent from last year’s 190,098” and there’s no evidence that things on that front have changed dramatically between April and July. If you have actual evidence otherwise, go ahead and post it.
From Vox: “One-fourth of new and continuing applications for H-1B visas — the permits that let companies bring highly skilled tech workers to the US — were declined in the last three months of 2018, according to new data from US Citizenship and Immigration Services. That’s down from just 5 percent for the same period in 2014, and follows on the heels of an executive order from Trump. The absolute number of new and continuing H-1B approvals has declined as well.”
And in Q1 2019, the denial rate for new H-1B’s was 32%.
Anecdotally, I’ve heard that many folks who have H1bs are finding it difficult to renew, with government throwing up roadblocks and nonsense paperwork. Plus the government is planning to revoke spousal work permits for those on h1bs. All that uncertainty means people are less willing to invest in real estate even though they have the income and means to do so.
Ignoring the real problem, which is that the economy is sputtering. We’re in a trade war with China. Confidence is down. Lower demand means lower prices.
Once again, you fail to show provide any evidence that “population growth is flat” in the Bay Area. Sure its not at the break-neck speed it once was but its certainly not plateaued.
It is plateauing. Check out the early May post by SS. Bay Area population growth slowed to .41% – lower than the slowing California growth rate of .47%. Several counties saw population declines. Small yes, but a decline nonetheless.
It’s possible that SF’s population will show a decline for January 2019 if the pattern from 2018 is replicated (the January 2018 SF population estimate was revised down by more than the subsequent population growth in 2018). If the January 2019 number is revised down by the same amount as the January 2018 then the population will have declined between 01/2018 to 01/2019.
Population growth in the Bay Area is slowing because we’re not building much housing. Our spare rooms, garages, in law units (legal and otherwise) are occupied. If the existing housing is largely filled, then the only way to get new people is to build more, which we are not doing.
And once again the MLS differs showing July 2019 with 512 sales of SFRs, condo+TICs and 2-4 units. July 2018 shows 505 such sales. It has got to be the TICs behind this discrepancy IMO.
Speaking of which, year-to-date sales in San Francisco remain at an 8-year low. And the pace of sales remains down.
According to First American, San Francisco has now experienced a 10.5% YoY decrease in the Real House Price Index (price adjusted for interest rates and income). From a technical perspective, the chart looks like it is printing a lower high for the first time since 2011.
The median Single family house was $1.55m based on a quick Redfin look.
A 2/1 in Mission Terrace, doesn’t make me think the market is down.
Funny you mention that. After almost two decades in real estate, when I hear the word “bubble” today I immediately think of SF District 10 SFR.
Interestingly enough I was looking at some home prices on the Daly City border the other day, and I think they may be catching up to nearby SF addresses due to looser regulations on rent and AirBnb.
Of course, there were nearly 300 single family homes which sold for less than $1.5 million over the past quarter in San Francisco, including a couple of 3/2s north of Golden Gate Park, a whole host in the Sunset, a fair number in Bernal Heights and a fully remodeled four-bedroom in the Bayview for under $1.2M.
yes and there were 21 under the median in that time promoted being a “fixer” too (4 over that number)
North of Golden Gate Park and west of 42nd ave. or a “development opportunity” you could have said.
The majority of the sunset houses were over $1000/ft.
I picked the house that showed to be the actual median house for the month (as that is what topic was), I wasn’t cherry picking. Nothing in what you wrote makes me think the market is down at all.
You have to read pretty far down, but it’s there. Headline should read “Median sale price for SF rose 3.8% year over year while Bay Area as a whole down 4.1%”
The shift here from focusing on prices (up) to volume (down slightly) is pretty remarkable.
You should always keep reading to the very end and “keep in mind that while movements in the median sale price are a great measure of what’s selling, they’re not necessarily a great measure of appreciation or changes in value and are susceptible to changes in mix, especially as sales volumes drop, as opposed to movements in the Case-Shiller Index.”
Okay, but keep in mind that Case Shiller also reflects SF home prices are at all time highs. So no plausible “changes in mix” issue there.
Believe me, eventually your call that prices have fallen will comport with the facts. I’ll be the first to say – you’re right!
Not quite. While the Case-Shiller index for the Bay Area as a whole is at an all-time high, the middle-tier actually peaked in July of last year, and is currently down, while the overall index (which has been underperforming the national index since the end of 2018, despite “Facebook, Apple, Netflix, Google” and all the IPOs) is now within a percent of negative territory on a year-over-year basis.
And of course, if the index turns negative, that simply means that the majority of values have dropped with the leading indicators having long ago turned.
What leading indicators “turned” and how and when?
For starters, there’s the new construction market, inventory levels and an expanding body of apples-to-apples results. In terms of timing, the current cycle started to turn in late 2015.
Four years on, none of those turned out to “indicate” much of significance, other than, perhaps, more price increases.