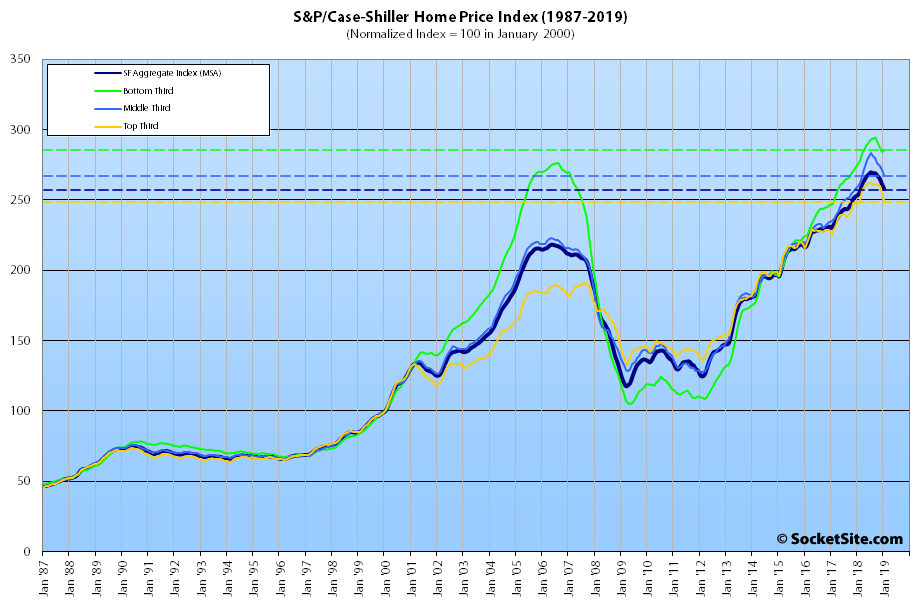
Having ended last year with the largest month-over-month decline in seven years, the S&P CoreLogic Case-Shiller Index for single-family home values within the San Francisco Metropolitan Area (which includes the East Bay, North Bay and Peninsula) dropped another 1.3 percent in January.
The index has dropped a total of 4.3 percent since the third quarter of 2018. And its year-over-year gain now measures 1.8 percent, representing the smallest year-over-year gain for the index since the second quarter of 2012.
While the index for the bottom third of the Bay Area market managed to eke out a 0.3 percent gain at the beginning of the year, its year-over-year gain has dropped to 3.6 percent, a drop of over eight (8) percentage points since January of 2018.
The index for the middle third of the market shed 1.5 percent in January but remains 3.0 percent higher on a year-over-year basis (versus 10.5 percent higher at the same time last year).
And the index for the top third of the market dropped 2.4 percent in January, its largest month-over-month drop in seven years, and its year-over-year gain has dropped to a total of 0.8 percent, down ten (10) percentage points since the first quarter of last year.
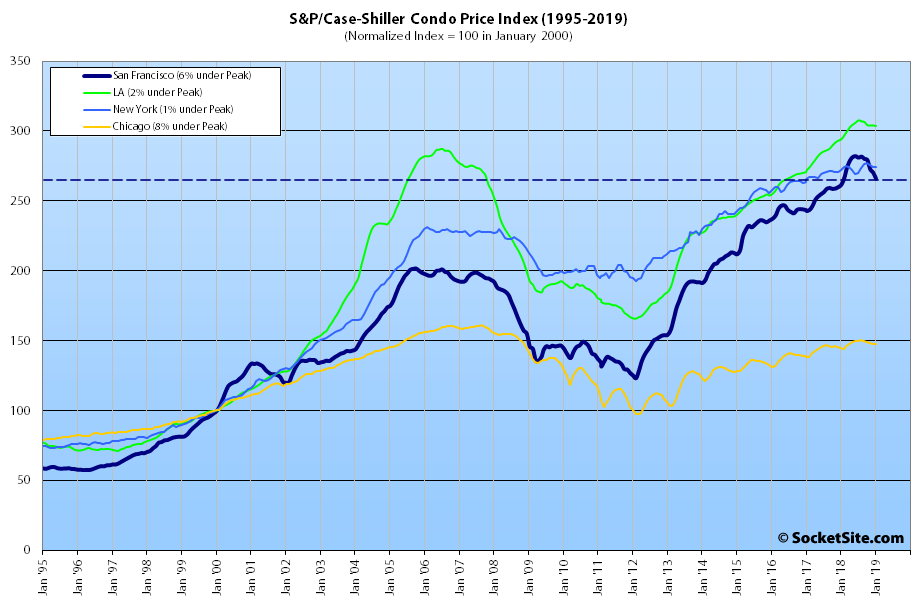
At the same time, the index for Bay Area condo values dropped another 1.6 percent in January. And having shed 5.7 percent since the second quarter of last year, the index is now running only 1.6 percent above its mark at the same time last year.
As we first noted in the third quarter of last year, Las Vegas is still leading the nation in terms of home price gains, up 10.5 percent year-over-year versus a national average of 4.3 percent, with Phoenix in second place (up 7.5 percent) and Minneapolis (up 5.1 percent) having displaced Atlanta (up 4.9 percent).
At 1.8 percent, San Francisco ranked second to last in terms of year-over-year gains, trailed only by San Diego (up 1.3 percent). And the national average was the lowest since 2015.
Our standard SocketSite S&P/Case-Shiller footnote: The S&P/Case-Shiller home price indices include San Francisco, San Mateo, Marin, Contra Costa and Alameda in the “San Francisco” index (i.e., greater MSA) and are imperfect in factoring out changes in property values due to improvements versus appreciation (although they try their best).
Socketsite guy, two things: 1) you rock 2) where do you get historical case shiller data?
Cheers. We pull the unadjusted data directly from S&P Dow Jones Indices.
the data tells the truth
I’d love the inflation adjusted data like Calculated Risk does each month – gives a much better picture that the nominal gains are not the same as real gains. Any chance of that data one of these days? Even if not – appreciate the hard work and posting these monthly. Also curious to see how much impact the recent drop in rates has on the data – though that won’t show up for a few months – if at all!
I’m still trying to process that weird August/September finale at the end of selling season last year. Glancing at a couple of comps on my side of the bay, I’m guessing we still have enough tailwinds for a new all time high this spring. After that, all bets are off…
It is likely home/condo appreciation will match the national average (give or take – this month being a take) for the medium term future. Prices have reached a glass ceiling to where even well paid techies and professionals are being priced out of the market – and there are only so many such individuals.
Employment growth is more or less stagnant. Up somewhat this past year but much lower than booming metros. The Bay Area did not even make the top 30 list of most robust job growth metros for 2018. Places like Portland, the Phoenix metro, Atlanta and Raleigh all made the list. More or less expected. But surprises included Reno and Boise. Both benefitting from jobs leaving the Bay Area and relocating there. Tech jobs will continue to leave the BA. HP is now shifting workers to Ft. Collins as well as Texas from the BA. The other thing which will kick in is stagnant population growth in the BA. At or below the national average.
This does not mean prices will collapse in the BA or even significantly decline, but there will likely be a definite pullback.
Atlanta’s unemployment rate is 4.8%. That’s pretty good! It’s also exactly double San Francisco’s unemployment rate.
According to this, SF alone got 28% of VC money in America, the Valley got another 18%. So the Bay Area got 46%. The lower value tech jobs will continue to leave the Bay Area, but they’ll be replaced because the tech economy is growing.
And yet, the aforementioned indexes are actually on the decline and sales recently dropped to an 11-year low despite an increase in inventory levels.
“Employment growth is more or less stagnant”, In SF this partly a product of the permitting/building speed. There are lots of jobs that are going to get added soonish: Park Tower, Parcel F, Oceanwide, Uber, etc. and all those new jobs coupled with “stagnant population growth”, says to me prices will go up for the housing stock.
Have we reached a glass ceiling? that is the question.
We’re at a self imposed ceiling. Basically everyone in San Francisco who wants to be employed is employed. There won’t be many new jobs because there isn’t anyplace for people to live.
Which some have been saying since mid-2016 when the unemployment rate fell to 3 percent (and since which time the number of employed people living in San Francisco has increased by over 40,000).
Just shows the strength of the SF economy, right?
Or at the very least, it highlights a fundamental misunderstanding that some people seem to have with respect to the concept of full employment (wage pressure, yes; inability for growth, no).
I think you are agreeing with me, so thanks!
Given that the only thing which grows without end is cancer, maybe a pull back from growth will be a good thing? Maybe not everything or everyone can be centered in the Bay Area?
“While the index for the bottom third of the Bay Area market managed to eke out a 0.3 percent gain at the beginning of the year, its year-over-year gain has dropped [to] 3.6 percent, a drop of over eight (8) percentage points since January of 2018.”
Maybe I’m just dense but what does this mean? Is the YOY drop 3.6% or 8%? Or is 3.6% represent 8 percentage points less than the YOY gain from January 2017 to January 2018 (which was 11.6% YOY)?
And I assume the 0.3% is month-over-month?
The month-over-month gain was 0.3 percent and the year-over-year gain was 3.6 percent (versus a year-over-year gain of 11.6 percent as measured in January of 2018). But the index has also dropped 3.1 percent since the third quarter of last year.