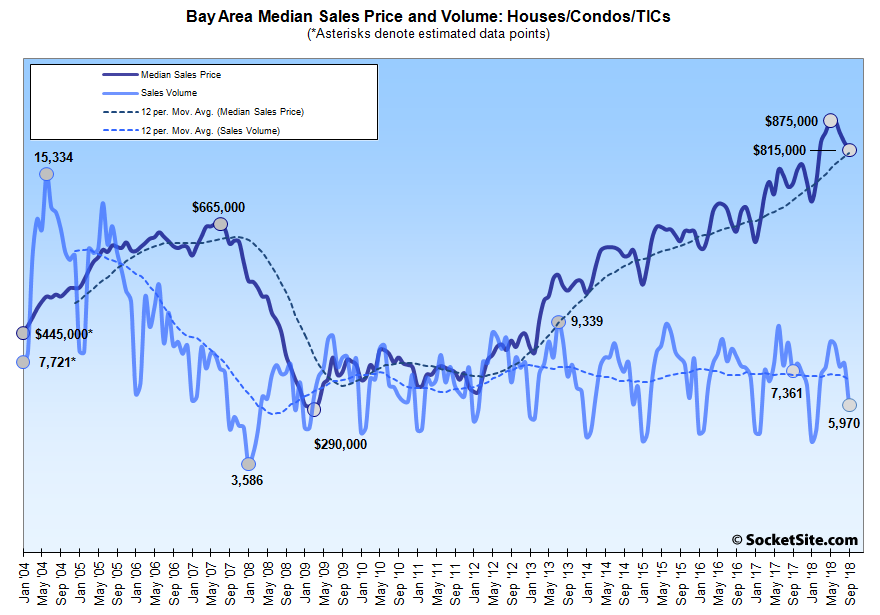
The number of single-family homes and condos that traded hands across the greater Bay Area totaled 5,970 in September, down 18.9 percent on a year-over-year basis and the slowest September in terms of sales since 2007, according to recorded sales data from CoreLogic.
In San Francisco, recorded sales totaled 360 in September, down over 22 percent from August, 6.5 percent lower on a year-over-year basis and the fewest September sales in over 15 years despite inventory levels having hit a 7-year high.

At the same time, while still pending sales in San Francisco were running an average of 5 percent lower on a year-over-year basis in September, pending sales have been running an average of 13 percent lower on a year-over-year basis in October. Again, despite the increase in inventory.
Across the bay, homes sales totaled 1,236 in Alameda County, down 20.7 percent on a year-over-year basis, sales in Contra Costa County totaled 1,201, down 19.8 percent, and sales in Solano County totaled 499, down 19.0 percent versus the same time last year. Home sales in Santa Clara County (1,357) were down 21.9 percent on a year-over-year basis in September while sales in San Mateo (481) were down 19.3 percent. And up north, home sales in Napa (117) were 1.7 percent lower, sales in Sonoma (461) were 19.5 percent lower, and sales in Marin (258) were 6.9 percent below their mark at the same time last year.
The median price paid for those aforementioned 360 homes in San Francisco was $1,300,000 in September, down 5.8 percent from a record $1,380,000 in May but 13 percent above its mark at the same time last year.
The median sale price in Alameda County dropped 3.0 percent to $825,000 last month but remains 8.3 percent higher on a year-over-year basis; the median sale price in Contra Costa County dropped 2.0 percent to $600,000 but is still running 7.1 percent higher, year-over-year; and the median sale price in Solano County held at $430,000, which is 7.5 percent higher versus the same time last year.
The median sale price in Santa Clara County dropped 4.8 percent in September to $1,061,000, which is 11.7 percent above its mark at the same time last year, while the median sale price in San Mateo County held at $1,300,000, which is 13.1 percent higher, year-over-year.
And up in Marin, the median sale price increased 5.0 percent to $1,050,000, which is 4.5 percent above its mark in September of 2017. The median in Napa dropped 4.1 percent to $633,000 but remains 11.1 percent above its mark at the same time last year, and the median sale price in Sonoma inched up 0.1 percent to $609,250, which is 6.6 percent higher on a year-over-year basis.
As such, the median home sale price across the greater Bay Area dropped 1.8 percent in September to $815,000 but remains 9.3 percent above its mark at the same time last year.
Keep in mind that while movements in the median sale price are a great measure of what’s selling, they’re not necessarily a great measure of appreciation or changes in value and are susceptible to changes in mix, as opposed to movements in the Case-Shiller Index.
Are there any metrics around Days-on-Market? Curious if houses are starting to sit on the market longer.
As we’ve previously noted, the oft-quoted “median days on the market” metric in San Francisco is about as valuable, and reliable, as those “over asking!” stats, with the re-listing of properties which haven’t sold, which is more prevalent in weaker markets, helping to drive the median down.
the pause that refreshes
Real estate is cyclical and more and more indicators – such as this – suggest that the Bay Area is on the down side of the current cycle. The only questions are the nature of this down cycle. Prices went flat for about 2 years starting in 2005 and then plunged over a 2 year period before then going generally flat for 3 years. Then in 2012, the price surge starts culminating in a peak – it would seem – in 2018..
Cycles only generally mirror one another. The 2005 – 2018 pattern is especially unique as it included the great recession/extended periods of low interest rates and quantitative easing. Plus an historic tech driven boom for the Bay Area. Those conditions will likely not happen again. The Bay Area will have more booms but likely nothing again like we have just seen. It seems likely the current down-cycle will last longer than the previous one but see only modest price declines. And that the next up cycle will not see anything like the appreciation seen in recent years.
Apparently we can’t overemphasize this enough, but movements in the median sale price are not the same thing as changes in value, especially when dramatic changes in volume aren’t evenly distributed across the market as a whole, as is currently the case.
I’m not sure what the story is here. Based on the chart, it seems like it will be even lower in October, and November and then climb back up again early next year? The chart of sales transactions looks pretty stable with seasonal fluctuations over the past 7 years. You can call it a, “plunge” I guess if you want. If the headline doesn’t work, you can consider a Minn Kota Endura C2 55 for what you’re trying to accomplish.
Again, Bay Area sales were “down 18.9 percent on a year-over-year basis” last month, the largest year-over-year drop in volume since 2010, resulting in “the slowest September in terms of sales since 2007.”
In San Francisco, the September sales volume was the lowest in over 15 years (yes, that includes 2007, 2008, 2009 and 2010).
And in fact, on a seasonally adjusted basis, the sales volume in San Francisco was 25 percent below the 10-year average for September while inventory has been running at a 7-year high and pending sales are down.
But sure, sales might look “pretty stable” if one doesn’t have a grasp of the underlying data and misreads the prose and/or charts.
Whether it should be called a plunge or not, the starting point this September, in terms of sales, is much lower than it was in Sept 13, 14, 15, 16 or 17. Starting point for the ensuing seasonal slowdown from September into early spring. So, overlaying the cycle pattern from these previous years on the September sales number would suggest sales numbers could drop to near term historic lows from October through early spring of next year.
Prices up, sales volume down…seems like the market has hit an equilibrium.
Prices up 13% and the market is “Plunging”…that dog don’t hunt.