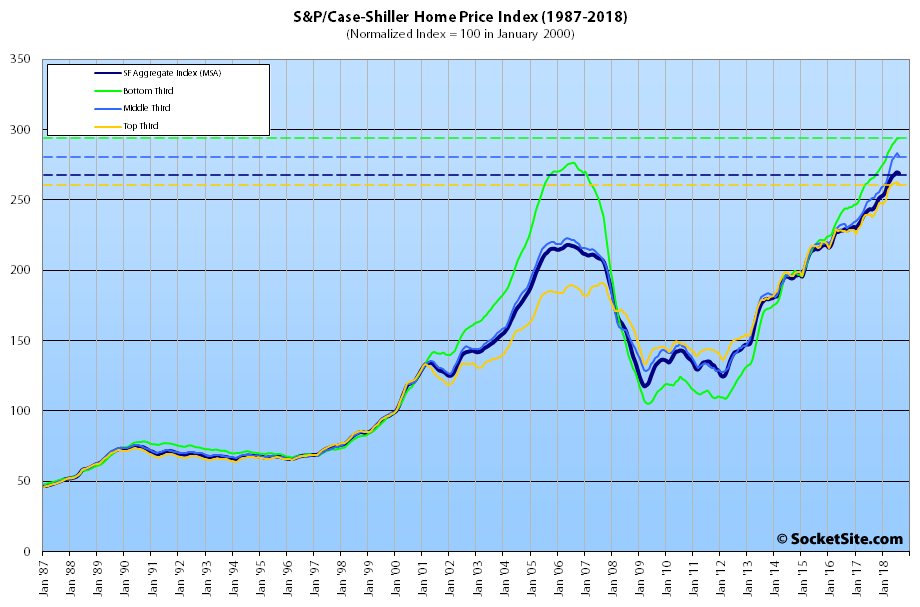
Having inched up 0.6 percent to a record high in July, the S&P CoreLogic Case-Shiller Index for single-family home values within the San Francisco Metropolitan Area – which includes the East Bay, North Bay and Peninsula – slipped 0.3 percent in August but remains 10.6 percent higher on a year-over-year basis with uneven gains across the market.
While the index for the bottom third of the Bay Area market inched up 0.2 percent in August, and is now running 10.8 percent above its mark at the same time last year, the index for the middle third of the market slipped 0.7 percent (but remains 12.1 percent higher versus the same time last year) and the index for the top third of the market slipped 0.6 percent (but remains 9.8 percent higher, year-over-year).
As such, while the index for the top third of the market is running 36.5 percent above its previous peak, which was reached in third quarter of 2007, the middle tier is running 26.4 percent above its previous peak which was set in the second quarter of 2006 and the index for the bottom third of the market, which had dropped over 60 percent from 2006 to 2012, is 6.4 percent above its previous high water mark.
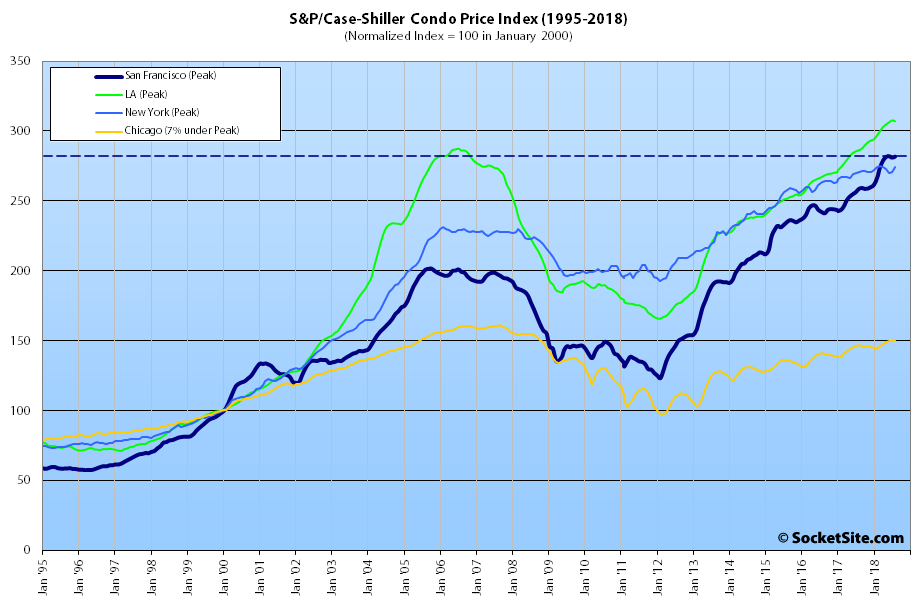
And having slipped 0.3 percent in July, the index for Bay Area condo values inched up 0.2 percent in August and remains 8.9 percent above its mark at the same time last year and 39.7 percent above its previous cycle peak in the fourth quarter of 2005.
And once again, Las Vegas is leading the nation in terms of home price gains, up 13.9 percent year-over-year versus a national average of 5.8 percent. Those who forget the past…
Our standard SocketSite S&P/Case-Shiller footnote: The S&P/Case-Shiller home price indices include San Francisco, San Mateo, Marin, Contra Costa and Alameda in the “San Francisco” index (i.e., greater MSA) and are imperfect in factoring out changes in property values due to improvements versus appreciation (although they try their best).