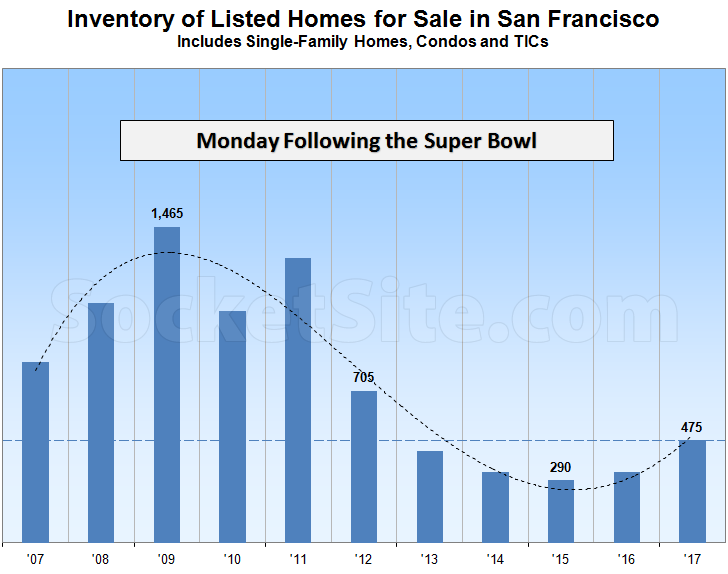
While the overall number of homes listed for sale in San Francisco slipped a little over the past week, it was a smaller than average dip for the week leading up to the Super Bowl. And the number of single-family homes and condos currently listed for sale in San Francisco now totals 475, which is 45 percent higher versus the same time last year and the highest total for this time of the year since 2012 (at which point there were 705 active listings on the MLS).
At a more granular level, while the number of single-family homes currently listed for sale in the city (155) is now running 28 percent higher versus the same time last year, the number of listed condominiums (320) is 55 percent higher, goosed by teaser listings for new construction units on the market, the vast majority of which are not included in the aforementioned counts and the inventory of which currently totals 1,000 (which is 76 percent higher versus the same time last year).
And in terms of pricing and expectations, 16 percent of the active listings in San Francisco have undergone at least one price reduction (versus 13 percent at the same time last year) and 37 percent of the homes on the market are currently listed for under a million dollars (versus 39 percent at the same time last year).
Keep in mind that inventory levels in San Francisco typically tick up in the week following the Super Bowl and then continue to climb through June or July.
This is an astonishing low figure in comparison to the number of interested buyers. Does anyone track any stats on buyer interest within certain price brackets. Seems like this is something that could be figured out to some extent between redfin and zillow traffic analysis. How many ppl would buy if the market dipped 5%, 10%, etc…. I probably know personally 475 people that would buy if there were a 10% dip. Too hard to forecast the mid term market right now.
@eddy, I’d add “within certain districts” as well. That would be an interesting picture to look at.
Keep in mind that we track true inventory levels, which account for both supply (new listings) and buyer demand (sales), not simply a sum of properties listed over a period of time.
In terms of measuring potential buyer demand and actual behavior in a weaker market, keep in mind that despite a 12 percent dip in pricing, new condo sales dropped 25 percent last year.
Overall home sales/demand in San Francisco, including single-family homes, were 5 percent lower in the fourth quarter of 2016 versus 2015 despite 35 percent more listed inventory from which to choose.
And of course, employment in San Francisco slipped at the end of last year.
What does “true inventory” mean? That is not a standard term. Active listings? All listings? Listings in contract? Something else? In the text you reference “the number of single-family homes and condos currently listed for sale in San Francisco.” Is that “true inventory” or does the latter term mean something else?
The 2017 number does look awfully low. Just above early 2013, which saw huge price increases.
As opposed to the sum of all new listings in a particular month or year, which is actually “supply” but numerous industry sources incorrectly label and report as “inventory.” Our inventory count is net of demand (sales) and only includes listed properties which are active and available, excluding those for which a contract has been written but has yet to close.
When demand exceeds supply, inventory levels drop. When supply exceeds demand, levels rise. Note the trend line above which changed direction in 2015. Or as we noted at the time: Most Condos On The Market In S.F. In Over Two Years and Greatest YOY Increase In San Francisco Homes For Sale Since 2011.
So it’s active inventory – thanks for clarifying.
I agree that a change in direction (active inventory goes from falling to rising or vice-versa) is worth noting. But, of course, it does not signify anything of note in terms of market strength. For example, going from an extremely strong sellers’ market to a very strong sellers’ market can result in an a change to the levels on the chart as you’ve defined it. So this is more of an interesting footnote point than an indicator of anything significant.
We focus on turning points and directionality. In terms of market strength, it’s weaker today that it was at the same time last year and has been trending down since 2015. And while moving from “an extremely strong sellers’ market” to “a very strong sellers’ market” certainly wouldn’t mean the market is crashing, it would suggest that values are poised to retreat, versus advance, as buyers gain leverage.
I think most here expected/expect a modest decline in SFH prices. No crash – this does seem to be an inflection point however. Or rather points – starting in late 2015.
A modest decline in overall prices will still have its impact on pipeline projects. If nothing else some will likely be delayed or the entitlement put up – as has been happening lately.
This year IIRC about 3K units are going to come online. That may carry over into 2018. Not sure. But it could be that housing production will slow and drop back below 3K further out. At a time when Seattle has been producing 5K units/year for a long while now and so far looks to be doing that for the next decade or so – through 2025 anyway. So there is a unique dynamic unfolding in SF – at least I sense that.
The mid-year and EOY numbers will perhaps confirm all this.
House by the zoo just sold for 600k or 46% over asking. Went pending 12 days from listing and closed in just over 20 days. Market is heating up.
Stories like that will get you more clicks socketsite.
Great point! Damn the data and overall trend, let’s look over there at a sale of a home that was completely renovated and listed at $680 per square foot, in an enclave where the average – not completely renovated – home has been selling for closer to $830 per square foot. And you say it sold quickly and for way over asking?
Works both ways. If listing price and time on the market is irrelevant then why do the articles on here always discuss price reductions when someone listed for an unreasonable amount or how realtors delist a property to reset the days on market clock?
Agreed. I have been tracking actual listed and sold SFHs in the Sunset and most have sold over asking still as of late. Sure, some were priced intentionally lower but still sales prices ended up at least 1M or slightly more for ok shaped ones or with tenant. The nicer ones that were vacant and dolled up were 1.3-15M and above. Buyers are going all in for the nicer ones (which makes sense).
“Works both ways””how realtors delist a property to reset the days on market clock”
It’s not quite the same both ways. Price/list and DOM get manipulated in one direction, but not the other. Realtors under price to puff up “over asking” and try to reset to reduce DOM. But no one is intentionally trying to set prices that will have to be reduced one or more times. And no one is trying to artificially increase DOM.
Everytime I see these lists I think it would be more helpful if single family homes were separate from condos. SF has 10,000+ condos in the pipeline. Then, if you separate out normal 3 bedroom, 2 bath houses from the mega mansions…. you would have a better picture of what the normal working family is up against. Maybe 150 houses at most?
[Editor’s Note: See our second and third paragraphs above.]
Does SocketSite have last year’s monthly inventory to show how the curve grows through the Spring? Or is there somewhere I can find that? We’re starting a process and would love to know how much inventory can potentially grow on a percentage basis in the coming months.
Based on the data we’ve collected over the past decade, inventory levels in San Francisco typically increase 45 percent from the beginning of February to mid-July.
Terrific. Thanks!
There are two different market dynamics at play here:
The top end of the market (+2M) has been softening, as the supply of luxury remodels has been strong over the past years.
At the same time, the bottom end of the market (<1M) is still appreciating. Neighborhoods like Bayview, Portola and Excelsior are still seeing price increases, due to the simple fact that there is nowhere else to go. Even in the East Bay, prices are not that much cheaper. Maybe lower rents will show an impact there in 2017, but so far, prices have been unaffected as far as I can see.
I don’t know about that.
“despite a 12 percent dip in pricing, new condo sales dropped 25 percent last year”
Slackening demand in the face of lower prices is a clear sign of market weakness. And I’m not sure, but I think the condo median price is under $1M. Obviously condo’s aren’t perfect substitutes for SFR’s, but that’s telling you something about the health of the sub $1M market.
The sub 1M single family house market is very competitive at the moment in my opinion. Properties that are listed sub 1M wind up going for 1M+ after 20 people write offers.
Over the past three months, there were over 130 single-family homes in San Francisco that were listed and sold for under a million dollars, with an average contract price of around $850,000.
But granted, only two of those were north of Golden Gate Park or the Panhandle.
OK. I don’t really have time for this. But if you were to look at 900K to 1.1M over the past three-four months, I think you’d see a lot of sales activity, and mostly over-bidding activity at that, indicating competition.Yes, the properties will mostly be in the southern parts of town or else the Sunset, and yes that is supposed to be a slow time of year.
But this is temporary thus lower prices will bring in more buyers.
As someone mentioned the other day there is some first order price-demand elasticity in housing prices, and it probably is significant over the very long term (decades). Shorter term, momentum matters a great deal though.
People are much more interested in buying when prices are rising than when prices are dropping. Getting the house you want for 10% cheaper sounds like a deal, getting into the market when prices are dropping at a rate of 10% is just catching a falling knife.
This isn’t a totally irrational behavior either. Look at the graph in the OP. About 6 years (’09-’15) peak to trough for inventory. The pricing cycle is out of phase from the inventory cycle, but the lengths are going to be about the same. So you’re looking at around a decade for a RE cycle peak to peak. Buying at the trough and spending a decade on a real estate rocket ride is going to produce a very different financial outcome vs being dragged underwater for a decade. Especially when people are stretching to get themselves into a property.
The industry is well aware of the fact that price momentum drives buyer interest and that’s why there’s so much effort put into manipulation of “over-asking” and DOM to create the perception of market momentum.
why would anyone not expect a flattening or soft market or even slightly declining values. We have doubled in the last 5 years. As a homeowner, im happy if the market cools until 2020 as long as we get that massive rise again from 2020-2024.
I bought in 2012 and would never buy in todays market. I assume the apples to apples prices in 2020 will be very similar to today . I hope anyone buying in 2017 has a 7 yr + horizon. I know I will be in my place for at least 6 more. (may move out of city when kiddles get to certain age.)
“(may move out of city when kiddles get to certain age.)” And you’re far from being alone in following that trajectory.
There’s been a ‘this time its different’ meme that this crop of SF arrivals will make the city home forever rather then make an eventual transition to the suburbs. But more likely then not, we’ve just been witnessing a demographic bump of 20-somethings.
“Here’s one thing we know: People get older. Another is that people’s tolerance for entry-level jobs and small urban apartments is highest when they are young adults. So while many things affect the increasing popularity of city living, including lower crime rates and a preference for walkable neighborhoods, one of the biggest factors is simply the number of people who are around 25.
Right now, that number is as high as it has been in decades. Another big driver of urban demand, immigration (both documented and undocumented), has been roughly constant since 2000. That number could change with policy, but given the current political climate, immigration seems unlikely to go up.”
“People are much more interested in buying when prices are rising than when prices are dropping. Getting the house you want for 10% cheaper sounds like a deal, getting into the market when prices are dropping at a rate of 10% is just catching a falling knife.”
This is such an excellent point and it is so hard to quantify. How do you model momentum and expectation buying? And it also reinforces that gut feeling one has about the market being over heated. Its interesting times with the combination of the expectation of increased home values and rising interest rates and a softening employment picture. What happens if you combine higher interest rates, softening demand and a recession?
My thought was there were always people who could afford median home price but werent forced to pay it. Now there are more people who can afford it (ie tech) but wont pay that high if they dont have to. Interesting times for sure.
January MLS sales numbers seem to be solid. 179 houses and 157 condos sold in January 2016 compared to 104 houses and 149 condos in January 2016. So maybe demand remains brisk enough to absorb the supply, keeping prices at least stable. At the very least, no signs of any real softening (au contraire).
When demand (sales) is greater than supply (new listings), inventory (as charted above) decreases.
When demand (sales) is less than supply (new listings), inventory increases (as charted above).