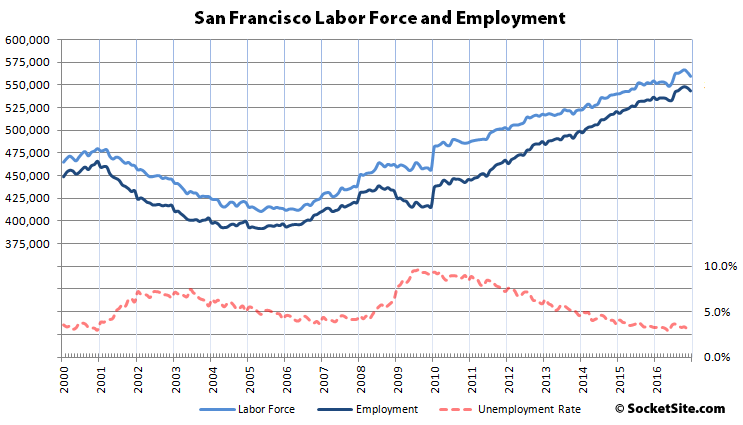
While employment typically ticks up at the end of the year with seasonal hiring, the number of people living in San Francisco with a job dropped by 3,300 in December to 543,300, the first December dip since 2009.
That being said, there are still 77,800 more people living in San Francisco with paychecks than there were at the end of 2000, an increase of 106,600 since January of 2010 and 6,900 more than at the same time last year. And with the labor force in San Francisco having shed 4,300 people in December, the unemployment rate dropped from 3.1 to 3.0 percent.
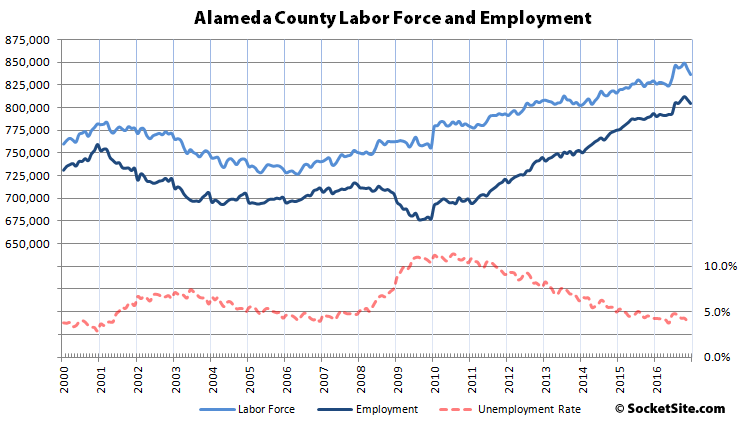
In Alameda County, which includes Oakland, while the unemployment rate dropped to 3.8 percent, employment dropped by 4,200 in December to 804,400, the first December drop since 2009 as well, but remains 11,100 higher than at the same time last year, an increase of 112,400 employed residents since January 2010.
And while the unemployment rate across the greater East Bay dropped to 3.9 percent, employment dropped by 8,000 to 1,338,600 in December.
Up north, employment in Marin County slipped by 400 to 140,200 while the unemployment rate dropped to 2.9 percent. And down in the valley, while the unemployment rate in San Mateo County dropped to 2.7 percent, employment dropped by 2,600, with employment dropping by 6,600 to 1,015,500 in Santa Clara County as its unemployment rate dropped to 3.3 percent.


Your headline should be:
112,000 more employed residents in SF since 2010; 20,000 housing units built since 2010.
All other data is peripheral.
Perhaps if we were writing industry press releases, but we’re not.
Keep in mind that sales of new construction condos in San Francisco dropped significantly last year, as did pricing. The inventory of existing homes for sale in SF has been ticking up, as have reductions in asking prices. And rents have dropped.
And as always, we’ll focus on the drivers, inflection points and leading indicators for the market, not the rhetoric.
Or 78,000 more employed residents in SF since end of 2000; 35,000 housing units built since end of 2000. Is my arbitrary time period more central than your arbitrary time period? Let every man/woman/etc be the arbiter of arbitrary comparisons.
SF Planning department puts the net-new housing units in the city from 2010 to 2015 more like 9,750 (quoting from the 2015 housing inventory report.
Or, ‘SF Unemployment Drops Even Further Below Previously Believed Theoretical Minumum. Also Dropped in East Bay.’
Of course, the actual unemployment rate in San Francisco measured an inconceivable 2.4 percent at the end of 1999. But why work with facts when we could run with a counterfactual generality that belies the driver of the trend in the fourth quarter…
Sorry, are you saying I’m not making a factual point?
We’re saying that referring to a generic theoretical minimum, while ignoring the fact that the actual unemployment rate in San Francisco was even lower 17 years ago, is either ignorant or misleading.
Hence the ‘previously believed’ part. (I’d point out that it’s misleading to base the headline on the total number of employee people rather than the unemployment rate, which inherently takes this into account.)
But that’s a quibble. How about the headline ‘Unemployment Rate Continues to Drop Farther in San Francisco and In All Surrounding Counties’?
Except the unemployment rate isn’t dropping because employment is increasing, which is a recent phenomena, atypical for this time of the year and a rather important distinction to understand.
Please don’t forget to also include the number of illegal in-law units added in the headline.
True. But then we would also want to add in all the illegal under the table off the books jobs. Not really a good method to count either one of those since the City really doesn’t want to know.
It’s worth understanding, yes, but if you’re going to base a headline on one number rising or falling, the unemployment rate is the one to use because it incorporates the total number of jobs already
Not if you’re actually trying to track the demand side of the housing market, which is driven by the actual number of people with jobs, not the unemployment rate.
Put another way, if the next twelve months followed the same employment and labor force movements as last month, the unemployment rate would drop to 1 percent! But there would be 40,000 fewer people in San Francisco with jobs and housing prices/rents would plummet.
But if the demand of the housing market is the goal, why bother with the unemployment rate at all?
So that when a plugged-in person reads a misleading headline, like “SF Unemployment Drops Even Further Below Previously Believed Theoretical Minumum,” they understand what’s actually going on.
That would actually be an accurate headline, not a misleading one. The unemployment rate in San Francisco is still dropping, is it not?
I think that just described the Zombie apocalypse. I like it.
Are baby boomers starting to retire in large numbers?
I think there could be 2 things happening. One is the retired baby boomers are moving into SF to enjoy city life. Another is the old SF residents decided to retire during the holiday.
I just read an article about how Trump is drafting an order that targets the H1B visa program. That could have a serious affect on local tech hiring.