With inventory ticking up and price reductions as well, recorded home sales activity in San Francisco was 6 percent lower on a year-over-year basis in April versus 4 percent lower the month before.
Sales activity did increase 12 percent from March to April with seasonality in play. And in fact, the month-over-month increase was roughly 9 percentage points higher than the average seasonal increase of closer to 3 percent that we’ve recorded over the past ten years. But the 12-month moving average continues to trend down.
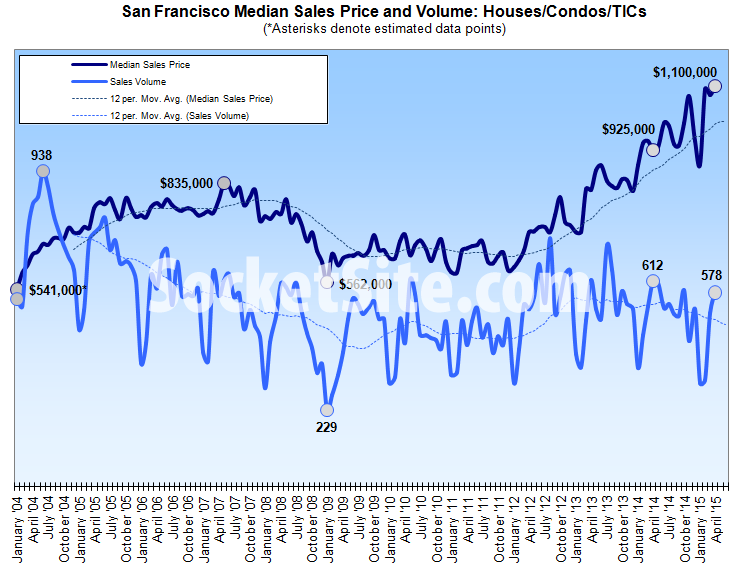
Having dropped from a record high of $1,092,500 in February to $1,075,000 in March, the median sale price ticked up 2.3 percent to a new record $1,100,000 in April, 18.9 percent higher versus the same time last year.
While movements in the median sale price are a great measure of what’s in demand and selling, they’re not necessarily a great measure of appreciation or changes in value and are susceptible to changes in mix, such as a significantly higher percentage of “luxury” sales which is currently driving the jump in the median above.
Bummer we can’t see the original source info like before.
Just look at the moving averages. Median $ on a constant upward trajectory largely independent of the inventory levels.
Nice figures. Median $ per sq ft for some of the more homogenous, less affected by luxury housing, areas are showing nice increases so I think there’s a danger of over doing the mix argument. In other words, prices are still increasing rapidly.
eg Outer Sunset + 23% YOY
Outer Richmond + 27% YOY
Parkside + 11% YOY
are 3 that I picked randomly…
[Editor’s Note: If you drill down into the history for those three neighborhoods, you might notice that an increasing share of the sales are for newly renovated, and many times expanded, homes. And considering that two of those three neighborhoods, out of the nearly hundred from which you could have randomly picked, are the same you picked last month, you might need a new randomizer.]
Yup. The same 3 I randomly picked last month. And OK, It wasn’t completely random. I wanted to pick hoods where I thought the was more homogenieity in the sales too.
Still not convinced the increases in these areas is mainly explained by the luxury market though, but I guess differing opinions are what this site is about.
If the share of increasing homes increases to the point where it becomes the standard then it essentially becomes the standard. And the homes that are not expanded are largely purchased with the intent to flip.