With inventory ticking up, recorded home sales activity in San Francisco was 4 percent lower on a year-over-year basis last month but jumped 63 percent versus February, primarily due to normal seasonality and a 30 percent drop in sales the month before.
Sales activity in San Francisco typically increases around 40 percent from February to March.
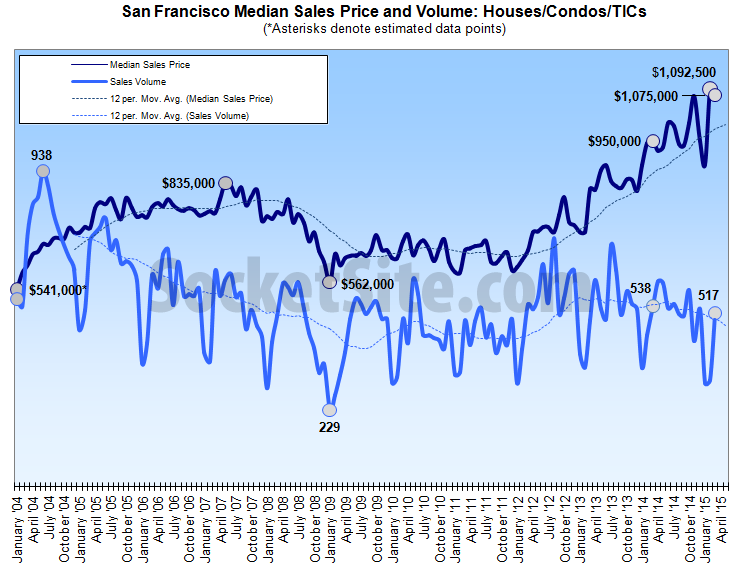
The median price paid for a home in San Francisco slipped to $1,075,000 in March, down 2 percent from the record high of $1,092,500 in February, but it remains 13.2 percent higher versus the same time last year.
Keep in mind that while movements in the median sale price are a great measure of what’s in demand and selling, they’re not necessarily a great measure of appreciation or changes in value and are susceptible to changes in mix, such as a significantly higher percentage of “luxury” sales.
Can you link the DQ source? Thx
[Editor’s Note: DQNews was acquired by CoreLogic which hasn’t yet released their Northern California report.]
Do sales and median price both slip?
Sales up strongly MOM down slightly YOY. Medians down slightly MOM up strongly YOY. Surely both measures should be consistent MOM or YOY. YOY is better obviously. You could just as easily pick that both medians and sales have increased than fallen…
Are there any theoriea as to what would cause the median sale prices to decrease while the Case-Shiller values to increase on a M-o-M basis?
Case-Shiller covers a larger area (SF MSA) and is smoothed (3 month moving average).
The other big difference is that CS tracks appreciation, while the median includes all the money being put into renovations.
Has the mix changed over the past few months?
[Editor’s Note: The fundamental difference: Case-Shiller measures changes in values while changes in the median do not.]
Looks like the median $ per sq ft is up about 15% YOY too, and 30%+ for 2 years. Now at around $960 per sq ft.
Not perfect, but a better indicator.
[Editor’s Note: Any thoughts on how the recent shift in share to a higher percentage of luxury sales might be impacting those numbers?]
It’s going up, of course. But at one point this site focused VERY heavily on the median per sq ft number. The percentage of luxury sales is always changing, and more now than ever most likely, but not sure that this means the median per sq ft has gone from a very useful indicator to useless in the space of a few years…
[Editor’s Note: We’ve definitely focused on price per square foot comparisons in the past, but almost exclusively when comparing prices within a neighborhood or building, or for a specific class of property, not averages across the city where significant shifts in mix come into play.]
Yup. Fair point. Some neighborhoods less affected by mix shifts have seen great increases though –
Outer Sunset +11% YOY, 33% in 2 years. Outer Parkside + 21% YOY, 44% in 2 years. Sunnyside +17% YOY, 41% in 2 years. etc.
So I think there’s definitely a pattern, even where mix would be much steadier, and the increasing luxury segment much less prevalent.