Single-family home values within the San Francisco MSA slipped 0.9 percent from December to January and condominium values slipped for the second month in a row (down another 0.4 percent), according to the latest S&P Case-Shiller Home Price Index.
While San Francisco home values dipped across all tiers of the market, with values for the top tier dropping the most, the aggregate index remains 7.9 percent higher on a year-over-year basis and has gained 68 percent since early 2009, but remains 9.6 percent below its 2006 peak.
The index for the bottom third of the market slipped 0.5 percent in January but remains 11.5 percent higher than at the same time last year; the index for middle third of the market slipped 0.6 percent in January (up 9.1 percent year-over-year); and the index for the top third of the market dropped 1.5 percent, it’s largest one-month dip since January 2012, but remains 6.8 percent higher year-over-year.
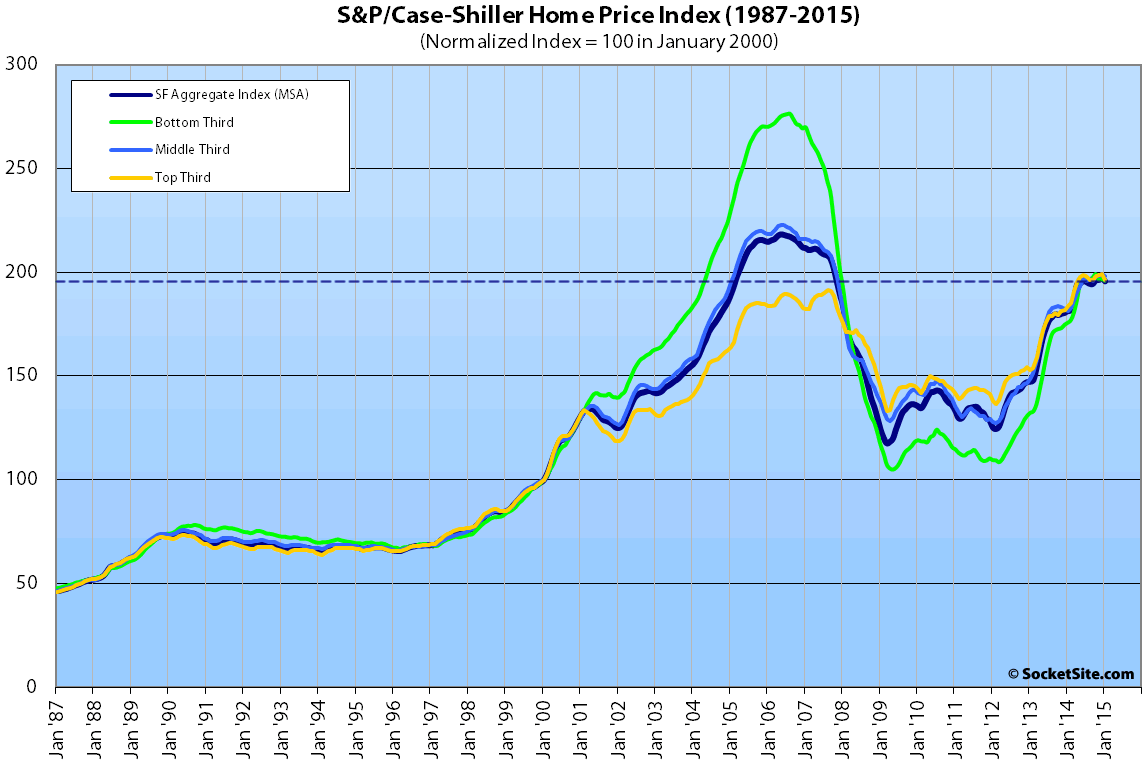
According to the index, single-family home values for the bottom third of the market in the San Francisco MSA are back to just below May 2004 levels (29 percent below an August 2006 peak); the middle third is back to February 2005 levels (11 percent below a May 2006 peak); and values for the top third of the market are 2.5 percent above their August 2007 peak, down 1.5 percent from December’s all-time high.
Condo values in San Francisco slipped 0.4 percent in January but remain 10.7 percent higher on a year-over-year basis and 5.1 percent higher than at the previous cycle peak reached in October of 2005, down 0.7 percent from an all-time high this past November.

For the broader 10-City U.S. composite index, home values were unchanged in January. And while the composite index is running 4.3 percent higher on a year-over-year basis, it remains 17.0 percent below its June 2006 peak.
From the Managing Director and Chairman of the Index Committee at S&P Dow Jones Indices, David M. Blitzer:
“Despite price gains, the housing market faces some difficulties. Home prices are rising roughly twice as fast as wages, putting pressure on potential homebuyers and heightening the risk that any uptick in interest rates could be a major setback. Moreover, the new home sector is weak; residential construction is still below its pre-crisis peak. Any time before 2008 that housing starts were as low as the current rate of one million, the economy was in a recession.”
Our standard SocketSite S&P/Case-Shiller footnote: The S&P/Case-Shiller home price indices include San Francisco, San Mateo, Marin, Contra Costa, and Alameda in the “San Francisco” index (i.e., greater MSA) and are imperfect in factoring out changes in property values due to improvements versus appreciation (although they try their best).
Did I understand the report correctly? SF is up 1.1% in January when adjusting for seasonality.
That doesn’t mean that values didn’t actually fall, but rather that the drop was less than expected based on historic seasonality (i.e., less demand at the end of the year leads to lower prices).
Keep in mind that the un-adjusted index for San Francisco home values increased from December to January in 2012/2013 and 2013/2014 as well. And before that, it hadn’t happened since 2004/2005.
May be seeing a plateau (which had to happen at some point). Buy I’d still sure rather be a seller than a buyer in this market. Stuff is still going for crazy sums.
Classic “double top.”
Not really. Higher high and higher low, up trend intact
Interesting. From wiki link:
Volume is another indicator for interpreting this formation. Price reaches the first peak on increased volume then falls down the valley with low volume. Another attempt on the rally up to the second peak should be on a lower volume.
The current rally has been driven by lower volume.
Volume is a secondary indicator, price is the primary. I think that volume may apply to stock but not necessarily to housing. Stocks can be sold quickly and there is rarely other considerations other than price.
Selling a house is a much more complex decision, it is affected by relocation, employment, social ties, income mobility etc. Recent lack of inventory and sales is a mystery, probably related to the small size of the GenY and the late home buying of the GenX. Once GenX starts to buy homes, price can really take off.
+1 for PRE’s comment.
SF price almost quadrupled from 1995 to 2006. It did not even double from 2011 to 2015, probably not peaked yet.
Those appreciation levels can be sustained only if the income level trends follow, which they haven’t.
Income is only one factor. Interest rate is another major factor. Even if income is constant, a falling interest rate will let people afford a higher price.
Also income has gone up significantly in SF.
Plus, lending standards during the 2004-2007 bubble were substantially more lenient than the current run up, and there was a vast disconnect in the rent/buy equation in the 2004-2007 bubble. So I would hope we would not see a similar “peak” to 2007, given that the rent/buy decision in SF is much more in line and the lending standards are stricter. I think we are at or near top of this cycle, particularly if tech starts winnowing out some of the unprofitable investments.