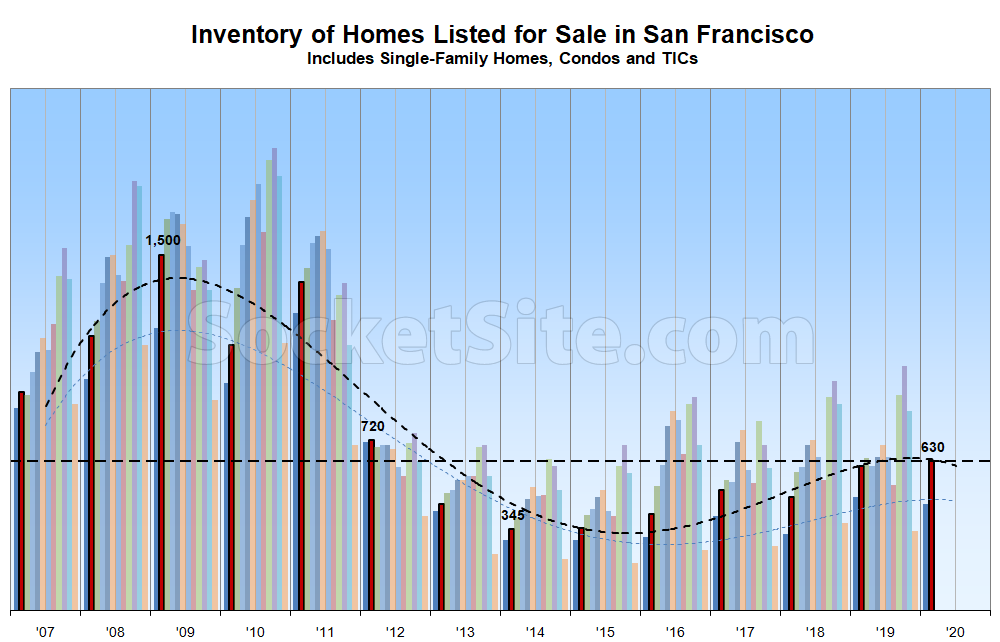
Following a trend which shouldn’t catch any plugged-in readers by surprise, the number of homes on the market in San Francisco (630) has jumped 25 percent since the Super Bowl. As such, inventory levels in the city are now running 3 percent higher than at the same time last year and just hit a new 7-year seasonal high.
At a more granular level, the number of condos listed for sale in the city (430) is now running 4 percent higher on a year-over-year basis while the number of single-family homes (200) is roughly even (up a percent), resulting in the first year-over-year increase in overall inventory levels since mid-November of last year.
At the same time, the percentage of listings which have undergone at least one official price reduction (which doesn’t include any of the homes which were withdrawn from the market at the end of last year and have recently been relisted with a reduced asking price and a reset ‘days on the market’ count) has slipped one (a) percentage point to 15 percent, which is two (2) percentage points lower than at the same time last year, while the percentage of homes on the market with a price tag of a million dollars or less has dropped to 23 percent (which is 6 percentage points lower than at the same time last year).
Expect inventory levels in San Francisco to continue to climb through mid-June with the relative pace of sales having slowed.

* this data is from MLS? so it doesnt include available new construction? probably quintuples condo number minumum
If people knew about off market inventory they’d realize that the market has gone much colder then is being popularly reported. An analysis of the New York market showed: “Nearly half of new condo units in Manhattan that came to market after 2015, or 3,695 of 7,727 apartments, remain unsold, “
Who cares about the New York market? It has been looking weird for years as condo buyers have been flocking to all inclusive nanny state buildings at the cost of cooler older flats. (*cooler is purely imo)
Because San Francisco year over year January looks like this per the MLS:
SFRs: 96 sales (and counting) ’20 @ $ 958.05ft vs. 98 sales ’19 $881/ft
Condos/TICs: 148 sales ’20 $1044.66/ft vs 114 sales ’19 $1027.43/ft
2-4 units: 34 sales ’20 $762.31/ft vs 18 sales ’19 $620.92/ft.
January is up YoY in all categories save a negligible 2 SFR sales And a few more late entry SFRs are likely to trickle in, still, as they always do…
The uptick in January sales shouldn’t have caught any plugged-in readers by surprise. But as previously outlined:
“While the pace of home sales in San Francisco started ticking up at the end of last year on a year-over-year basis, having dropped in 2019 overall, keep in mind that said sales were compared to 10 and 11-year lows in San Francisco and the Bay Area at the end of 2018 and early 2019 as well.
And in fact, while contact activity in San Francisco was running around 18 percent higher on a year-over-year basis [in January], it has since dropped to an average of 5 percent higher over the past two weeks, or roughly 1 percent higher over the past week alone. And compared to 2018, contract activity is currently down nearly 20 percent while inventory levels are up.”
It would be helpful if this website ceased countering takes that are “volume + price” with mere volume takes. It’s misleading and of course, as always, odd who is addressed by the editor(s) and who is not.
Speaking of consistently misleading hot takes, there’s a difference between the average price of what’s selling versus actual changes in values when measured on an apples-to-apples or indexed basis, particularly when the mix of what’s selling is in flux.
Yes because new construction and new remodeling has nothing to do with current values, apples are the end all be all, and apples take age and obsolescence into account. [/sarcasm]
While the majority of new construction units remain unlisted, there are fewer than 800 new construction units, including those in developments which are not yet ready for occupancy, currently on the market. And while that’s around twice the number of listed units, it’s not “quintuple at a minimum” and the current ratio of listed to unlisted inventory levels isn’t substantially different than at the same time last year.
What is the soon to be implemented ban on pocket listings going to do for inventory numbers?