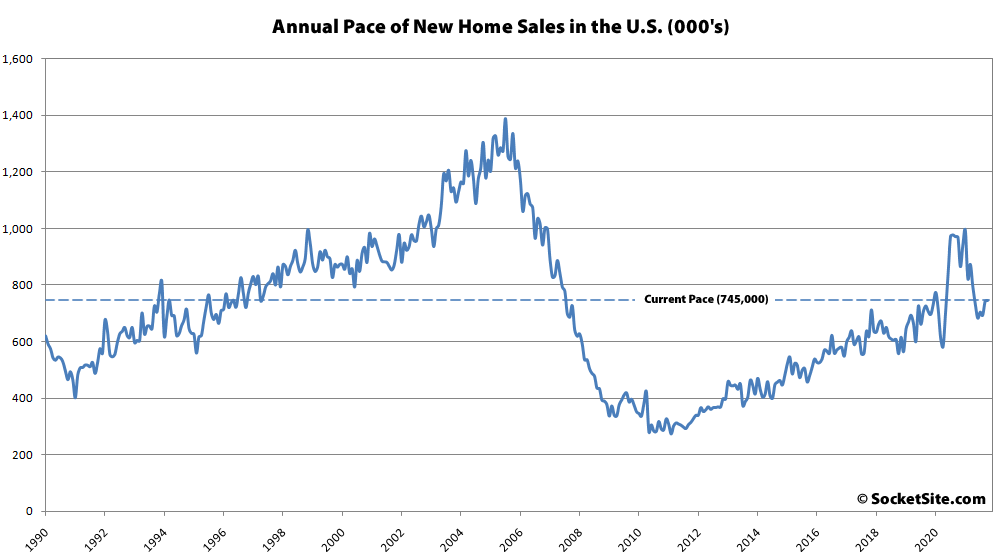
Having jumped a downwardly revised 7.1 percent in September, the seasonally adjusted pace of new single-family home sales in the U.S. inched up 0.4 percent last month to an annualized rate of 745,000 homes but was down 23.1 percent on a year-over-year basis and 25 percent lower than at the start of the year.
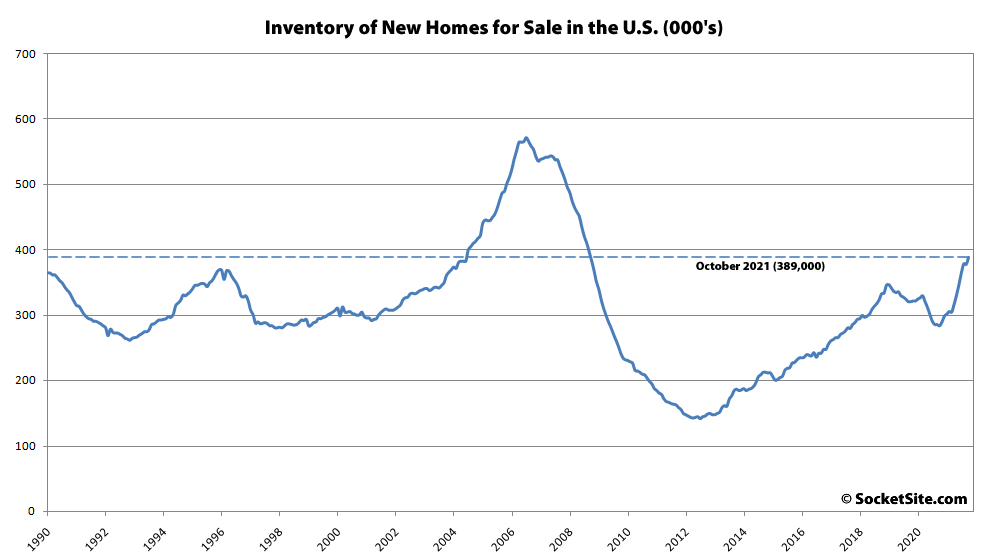
At the same time, the number of new homes on the market across the country, net of new sales, ticked up 2.9 percent to 389,000, representing 37 percent more new homes on the market than there were at the same time last year and the most new home inventory in the U.S. since September of 2008, a figure that shouldn’t catch any plugged-in reader’s by surprise.
And while the median price of the homes which sold last month ($407,700) was 0.7 percent higher than in September and 21.1 percent higher than at the same time last year, that’s with 54 percent of the sales having been for homes with a sale price of at least $400,000 last month versus only 37 percent of the sales at the same time last year (i.e., the jump in the median is being driven by a change in the mix of what’s selling not “appreciation” per se).


> 54 percent of the sales having been for homes with a sale price of at least $400,000 last month versus only 37 percent of the sales at the same time last year
Is this at root of your argument we’re seeing a change in mix versus actual appreciation? This sounds like an arbitrary and potentially misleadimg way to measure. If all real estate appreciates by 20% YoY, of course a higher proportion will sell for over some arbitrary dollar amount than in the year prior. What am I missing that tells you we’re seeing a change in mix?
I would be creating and tracking some “basket of housing”, similar to a CPI, that surveys prices in some collection of zip codes, and controlling for things like square footage, bedrooms, lot size, etc.
Again, I’m by no means a real estate person so I must be missing something, and would love to learn what that is.