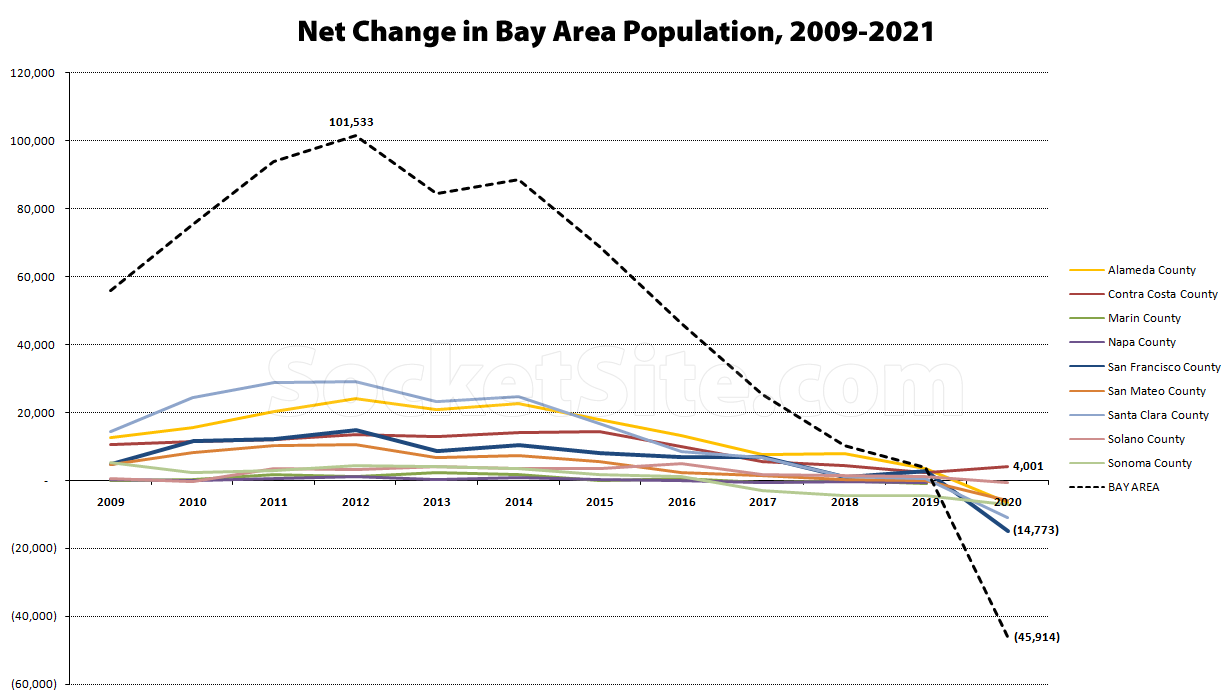
Following a trend that shouldn’t catch any plugged-in reader’s by surprise, the estimated population of San Francisco proper decreased by 14,773 (1.7 percent) in 2020, representing the largest decline across all of the Bay Area counties on both an absolute and percentage basis, for an estimated population of 875,010 at the end of 2020 and start of 2021.
And with Contra Costa County the only Bay Area County that recorded a gain in 2020 (up by 4,001 or 0.3 percent), the Bay Area population dropped for the first time in over a decade last year, declining by 45,914 (0.6 percent) to 7,703,016 with effectively no growth (up 0.05 percent) in 2019.
At the same time, around 20,000 new units of housing were completed across the Bay Area for a total of around 2,945,000 units overall, with around 4,000 units of housing having been delivered in San Francisco proper last year for a new total of around 408,000 units, from single-family homes to single-room occupancy (SRO) rentals, overall.
Obviously, too much population decline is a bad thing and it’s a fine line to walk. But to me, this is good news. We need a better balance between jobs and housing. The situation in 2014-2020 was out of control. Hopefully this is a nice 3-5 year reset period where housing production/availability can catch up and we can have sustainable, healthy growth moving forward.
And yet post office change-of-address data for 2020 says around a net 90,000 people left SF just in the six months before 11/20 alone.
ahh yes the post office, the well known authority on population statistics.
The PO simply supplied the data, I don’t believe they interpreted it. But anyway it’s the type of info – along with similar data from the DMV – that the CA Dept of Finance, from whence these estimates come, uses.
Actually post office data is a pretty reliable indicator of people moving. No one’s saying they’re the census bureau, but they do have a thumb closely on the pulse of where people live and move.
Post office changes of address overlook the entire component of international migration, which is significant in SF and the Bay Area.
So 90,000 people left in a 6 month period from June trough November, during the height of the pandemic lockdown. And in the rest of the year, how many people left or moved in? You know, like those few months at the beginning when covid-19 wasn’t even a thing, or wasn’t being taken as seriously? Or how about december, when the pandemic started to be taken less seriously again, because we finally started getting vaccinated? Also, how many people were born in SF during this entire time? Take all that into account, and maybe the population loss for the whole year actually was closer to 15,000, like the state of CA says.
“You know, like those few months at the beginning when covid-19 wasn’t even a thing, or wasn’t being taken as seriously?”
Pardon? Those first few months when large gatherings were legally prohibited? When large events like the NBA cancelled their entire seasons? When flights were landed across the country? When every office was mandated to begin working from home? Those first few months?
The lockdowns in the Bay Area didn’t start until March 17th. So, yes. Those first few months of the year would not have had a mass migration out of the city.
And then for the first couple months of the lockdown, most people probably did not expect the pandemic to last for over a year, and would be less likely to feel that they have to move away from the city. But then as the pandemic drags on, and the end looks farther and farther away, the number of people who feel the need to leave grows, as people’s bank accounts get smaller, and the fear rises. Pretty simple concept to understand.
As previously noted and discussed at the time, the “change of address” report(ing) was deeply flawed, to say the least.
But the vacancy rate and labor force trends we’ve highlighted have been right in line (along with the resultant drop in rents and associated property values).
VCs continue their shock and awe campaign:
Between January and March, the venture industry invested $25.3 billion into San Francisco and Silicon Valley-based companies, according to the latest quarterly report on the industry from PitchBook Data and the National Venture Capital Association. That was the second highest quarterly total ever, exceeded only by the fourth quarter of 2018, when investors plowed $27.4 billion into the region’s startups.
Ya can’t move Sand Hill Rd
But remember that between Jan-March most companies were (and still are) operating mostly remote. Just like the person who pointed to the fact that public tech company stock prices were hitting new heights, this is a story of the dog that didn’t bark.
Companies have been operating 80+% remote for a while now (probably close to 100% remote for some pure software shops) and operations have continued, new products have been introduced, public company stock prices have done well and now VC funding has continued unabated.
COVID forced a test whereby most everyone went remote and very little went wrong. The dogs that didn’t bark (things that didn’t go wrong) are all points for, not against, remote/distributed/alternative work models.
As I noted in my comment Friday, a few BA cities – specifically Oakland and Santa Clara – actually gained people, while their larger neighbors lost them. (In the case of the former, it means SF is once again almost exactly twice as populous as Oakland…there had been some divergence over the past few years.)
Oakland was the second fastest growing large city in California after Bakersfield. 0.8% – not exactly fast growing but then again it’s all relative. Personally know 3 longtime PG&E employees who, with the move of the company and thousands of jobs to Oakland, have decamped SF for Oakland.
The decrease in rents should flow through to a decrease in multi family prices. Has this happened? Any good examples of apartment buildings trading down?
What do you think the mechanism is for forcing that decrease in prices to happen?
I’m certainly no expert; wouldn’t banks have to foreclose on overleveraged small-time landlords and then put those multi family properties on the market in distressed sales? Haven’t seen that happening, and also haven’t seen many “mom and pop” landlords throwing in the towel and selling in advance of foreclosure. Everybody is waiting on the Biden bailout that is sure to come.
By Biden bailout do you mean higher capital gains tax and eliminating the 1031 exchange? Both are bad for business.
Unclear whether those are bad for business. One of many obvious counterarguments is that higher tax revenue means more money to spend on infrastructure, which is good for business.
Uneven economic growth can be a drag – smaller consumer base, rich have a lower propensity to spend vs invest, etc
If you’re attempting to argue in favor of trickle down economics, the slight problem with your argument is that it has never worked.
The Gavin bailout is coming. Everyone who didn’t pay rent due to COVID will be bailed out with 100% payback to landlords under the latest huge-budget-surplus spending plan.
Not sure why you are describing this as a bailout for people who didn’t pay rent. It’s just as much a bailout of landlords, who wouldn’t have been able to fill the vacancy even if they had been allowed to evict.
As we noted seven months ago, back when asking rents and their associated income streams were 10 percent higher than today:
“Multifamily home inventory is currently up 50 percent on a year-over-year basis and running at a 9-year high in the absolute, with the 10 most recently listed 2-4 unit buildings having been listed with an average CAP rate of over 4 percent.”
Multifamily inventory is now up closer to 200 percent on a year-over-year basis and the average listed CAP rate is closing in on 5 percent (which isn’t being driven by an increase in rents, but rather a drop in pricing, and which shouldn’t catch any plugged-in readers by surprise).
Where are you getting the average listed cap rate at 5% from? If its from the MLS, particularly 2-4 unit buildings, it will be inaccurate. Cap rates haven’t changed that much due to low interest rates (they’re a little higher), but prices have changed because the underlying rents to arrive at these calculations are much lower.
Care to share an example of a low price-per-unit or psf that has sold recently? I haven’t seen anything that looks like that much of a bargain.
Don’t have any of those examples. Don’t think they exist.
Any idea what portion of the SF multi-family rental stock is under rent control? And/or what portion of the for-sale inventory?
Inflation looks like its staring to pick up which seems like it will have divergent effects on rent controlled vs market properties. Talking to some old timers it seems that long periods of inflation was financially ruinous to rent controlled landlords in the past since only a portion of the inflation rate can be applied to rents. And the CPI official inflation rate may understate actual increases of costs. Conversely, market rate rental housing seems like a pretty good inflation hedge since inflation of actual costs can be fully passed through.
Additionally, while market rents have certainly dropped I wonder a bit what has happened to actual collected rents in rent controlled buildings. Some people I know who have left SF had been here a while. Don’t know details, but spitballing based on how old their building looked and how long they’d been here I have to assume that even if market rents have dropped since last year if their landlords were able to fill their vacancies, they’d actually be bringing in more money in the absolute.
Let’s reduce income/wealth inequality in America, and populations will go up again, including the Bay Area. Population increase (from births) is stalling in America as a result of lack of faith in American economy. Also we need to get people trained and skilled up for the new reality, which will give people more reason to stay. We also need more legal immigrants, flushing the country with new wave of energy.
Fed’s (Census Bureau) have now chimed in with their own figures. They largely accord with the earlier state figures directionally, but as is typical they’re materially lower than the latter in absolute numbers…which “shouldn’t catch SS readers by surprise” (since I point it out every time it comes up!!)
And note also the estimates are, I believe, for the Census period (AP’20) whereas the state DoF figures are 01/01/20 vs. 01/01/21…for those who want to compare them directly.
And for those who want to look right into the horse’s mouth. A deep dive into the ‘excel’ columns will show SF’s population peaked…in 2018 (and has fallen by ~14k since then)