Having inched up in October, the S&P CoreLogic Case-Shiller Index for single-family home values within the San Francisco Metropolitan Area – which includes the East Bay, North Bay and Peninsula – slipped 0.1 percent in November while the index for Bay Area condo values inched up by the same amount.
At the same time, the national index for single-family home values inched up 0.2 percent. And the only three Metropolitan Areas to record declines were Chicago (0.8 percent), Detroit (0.1 percent), and San Francisco.
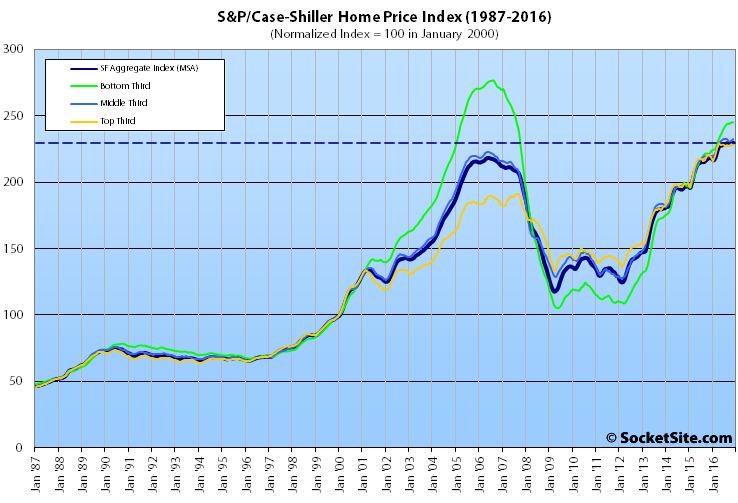
On a year-over-year basis, the aggregate index for area single-family homes is still running 5.3 percent higher. But that’s the smallest year-over-year gain since the third quarter of 2012 and the gains have been trending down for over a year, with the upper end of the market expressing signs of weakness.
While 10.5 percent higher versus the same time last year, the index for the bottom third of the Bay Area market was unchanged in November and remains 11.4 percent below its 2006-era peak.
Home values for the middle third of the market gained 0.5 percent in November and are running 5.8 percent higher versus the same time last year but remain 0.2 percent below an August 2016 peak.
And while the index for the top end of the market remains 19.0 percent above a 2007-era peak, it dropped 0.5 percent in November and its year-over-year gain of 3.3 percent is the smallest since mid-2012 and has been trending down since October of last year.
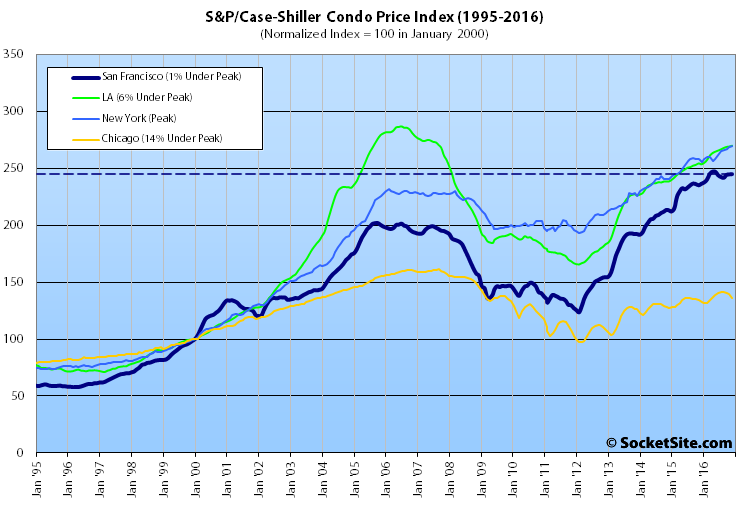
Having inched up 0.1 percent in November, the index for Bay Area condo values remains 4.2 percent higher versus the same time last year and 21.3 percent above its previous cycle peak in October 2005.
And for the ninth month in a row, Seattle, Portland and Denver have reported the highest year-over-year gains in the index for single-family homes, up 10.4 percent, 10.1 percent and 8.7 percent respectively.
Our standard SocketSite S&P/Case-Shiller footnote: The S&P/Case-Shiller home price indices include San Francisco, San Mateo, Marin, Contra Costa and Alameda in the “San Francisco” index (i.e., greater MSA) and are imperfect in factoring out changes in property values due to improvements versus appreciation (although they try their best).
Concerning to see the bottom third moving away from the other tiers. Looking back that has been a leading indicator of a disconnect between housing values. I’ll be keeping an eye on this stat.
very true, the bottom falls the hardest and risest the most / more volatile.
as an example of this, in the last bust, a property in concord sold for 660k in 2006. it was subsequently abandonded, trashed, forclosed, and auctioned for 166k in 2008. it was bought by flippers, fixed up and sold, to me, for 320k in 2009. in 2015 i sold it for 469k, and now it is valued a bit over 500k per redfin (which i think is by far the most accurate estimator for bay area).
as the chart shows above, the bottom 3rd still isnt at the prior peak but moving up there, and this totally supports my personal experience in that market.
I don’t think a crash or big downturn in prices is coming. If anything this indicates a leveling of prices across the board (condos and SFRs). This is not to say there won’t be a further decline in prices – only that it will be small to modest – if it happens. IMO.
The Bay Area is not out of he woods however. The numbers for Seattle and Portland this past year show a robust appreciation in home prices – this has occurred in other cities too – and that to me is the story.
In the coming decade I believe we will see markets such as Seattle and Portland outperform the Bay Area in appreciation. Playing “catch up” to a point. They won’t overtake the Bay Area in home prices.
Key factors are in place for such vibrant cities – an equal or better quality of life than the Bay Area, an educated population base, population growth, and job growth (especially tech jobs).
Check back in 10 to see how this all plays out.
Last weekend I imported Zillow SF sales data into my stock charts using Quandl and ran some basic technical analysis (triple moving average, bollinger bands, linear regression, and Elliot Wave/Wyckoff). I’d say we’re looking at a sideways consolidation phase that matches 2002-2003 and 2007-2008. After these periods, the former saw a new uptrend form, and the latter a new downtrend. Combined with fundamental analysis of slowing job growth, rising interest rates, increasing supply, and aging economic expansion, I’d lean downtrend. Also, this last uptrend was about twice as intense as the dot com and housing bubble periods, so if you believe in mean reversion it could be a big one.
Whoa, you have changed your tune, finally. You seem to be acknowledging that Bay Area prices are relatively “real”, where you were so dismissive before. Funny how you could do all of this statistical work, yet in the past showed no acceptance of the historical correlations between local incomes and local pricing. I.e., absent giant macro influences as in the financial crisis, job growth and super high incomes among the professional class here are driving home prices here.
What happened to your model when you put having a maniac in office?
All good forecasting models include a dummy variable …or two.
So far the markets are more hopeful than fearful, and the markets are usually pretty smart. But I will admit this last weekend he was sounding pretty loony.
But any economic crash was set up way before Trump came onto the scene. The average economic expansion is five years and the longest is ten, we’re already at eight years which is second longest.
Obama ran up the debt by 86% from $10.7T to $19.6T and the Fed expanded its balance sheet by 450% to keep the car looking shiny, but things were not that great under the hood. He was the only president that didn’t see a single year of 3% GDP growth, and fourth lowest average GDP in history.
Real median income is back to 1997 levels but gains went mainly to the top earners. Labor force participation is at 1978 levels. And all that debt is now a drag on growth because it must be serviced. He inherited most of the problems from Bush, but he also declined to jail a single banker despite billions in fines, so I have little sympathy.
Real estate is local and any general downturn will impact different areas to greater or lesser extents.
The affordability component makes the Bay Area more vulnerable to rate increases and a general downturn.
The trillion dollar infrastructure stimulus, which Trump will have to work with the Dems to get through as the GOP Congress does not seem to have majorities in its own caucus to pass, will be a factor too. Unfortunately, if passed, it is likely to benefit Atlanta, Texas and mid-western cities more than the Bay Area which can’t get its act together. So that could be a boon to RE prices but maybe not BA prices.
If overseas corporate money is repatriated and as part of the deal is targeted to some of the money being invested in depressed areas like the mid-West (Michigan) and cities like Baltimore, the BA will lose out too.
Just saying there is a lot in the mix here and RE will react differently depending on the market – even in a downturn. That is partly why I feel Bay Area RE appreciation will lag some other areas in coming years.
All good. It was more of a joke than anything. Agreed we are due for a recession And in general i think presidents can do little to affect/effect the economy but they can – especially this one – cause damage to the economy. His being in office, along with our agreed upon expectation of the next recession happening sooner rather than later, could make things worse from a housing value and recession perspective
We are off to a fast start this year. Many homes going pending this week have been on the market less than 20 days and one house sold for half a million (> 30%) over asking.
How does that compare to the same time last year? Because based on listing/inventory data, January sales would appear to be down – not up – in San Francisco, year-over-year.
Will January sales and median price SFR be published?
As always, we’ll report recorded sales and median price for San Francisco and the surrounding counties once they’re tallied. Speaking of which: Bay Area Home Sales Dropped Nearly 10% in December, More in SF.