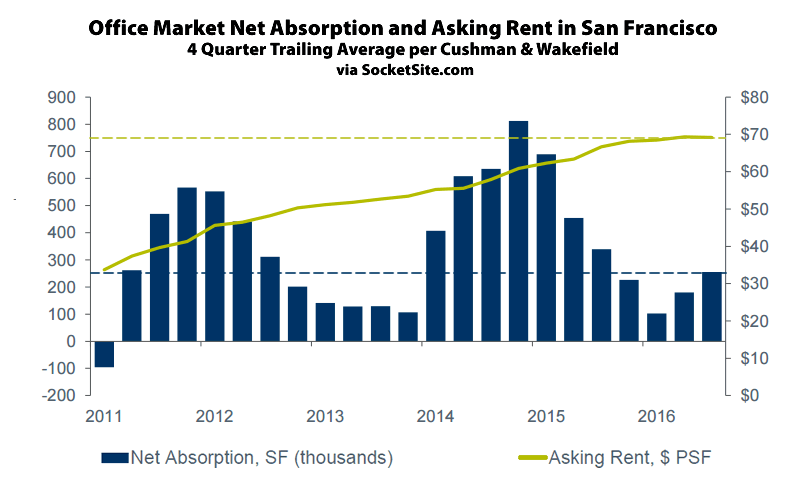
As we first reported at the beginning of the year, demand for office space in San Francisco was dropping. A few months later, we noted that the office vacancy rate was on the rise. And last quarter, the vacancy rate ticked up to 7.7 percent, the highest vacancy rate since the third quarter of 2014, and the overall asking office rental costs dropped for the first time since the second quarter of 2010, albeit by a nominal $0.10 per square foot, according to data from Cushman & Wakefield.
In addition to 4.5 million square feet of truly vacant space, which is up from 4.1 million square feet last quarter, the amount of rented office space available for sublease remains at 1.5 million square feet with tech firms accounting for roughly half the excess space being offered.
On the demand side, new leasing activity in the second quarter totaled 875,00 square feet, down from 1.3 million square feet in the second quarter and the year-to-date leasing activity totals 4.4 million square feet, which is the lowest year-to-date total since 2010.
At the same time, companies are actively looking for 4.0 million square feet of space, which is the lowest active need in three years but up from 3.6 million square feet in the second quarter with 3.8 million square feet of new office space under construction in the city, roughly a quarter of which is currently pre-leased.
All that being said, the current office vacancy rate of 7.7 percent remains two points below the long-term average for San Francisco and the average asking rent of $69.21 per square foot is 3.7% higher versus the asking rent of $66.71 per square foot in place at the same time last year.
Even Janet Yellen herself can’t deny the CRE bubble: “In general, I would not say that asset valuations are out of line with historical norms. But there are areas, my colleague President Rosengren has focused on commercial real estate where price to rent are very high and cap rates are very low. That’s something that has caught our attention.”
Probably the most interesting trend to watch. The wework folks are absorbing lots of sqft and creating more elasticity in the supply that I think somehow factors into the equation like never before.
To confirm, asking rents dropped by $0.10/$69.31 per foot or -0.14%?
Yeah, normally I don’t approve of those IBD-Style charts that are truncated to make some kind of trivial change look like a 50% drop, but in this case some kind of embellishment – make a circled area of magnification – is necessary to make the point…it just looks like a flat line, as-is.
UPDATE: In related news, Spillover Demand from SF Slows but East Bay Office Rents Tick Up