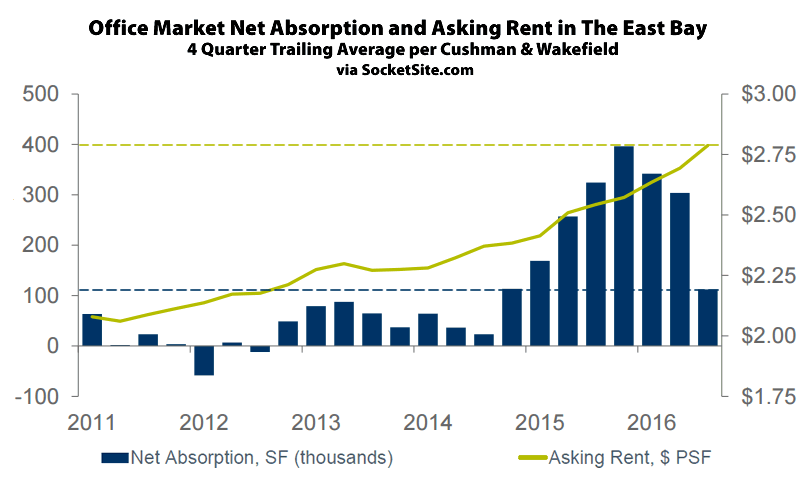
Asking rents in Oakland’s Central Business District ticked up 1.2 percent in the third quarter and are now running 20 percent higher on a year-over-year basis while the asking rent for office space across the greater East Bay market gained 3.7 percent and is 8.6 percent higher versus the same time last year, according to Cushman & Wakefield.
At the same time, the vacancy rate for office space in Oakland ticked up from 2.8 to 4.0 percent versus 7.7 percent in San Francisco and 5.8 percent at the same time last year. And the greater East Bay vacancy rate ticked up to 8.6 percent, which is the first up-tick since the end of 2014 but well below the long-term historical average of 13.8 percent, in part as “the spate of tenant demand from San Francisco…has ebbed over the last several months as that market has seen a pullback in demand” and an increase in available space, as we foreshadowed earlier this year.
That being said, at roughly $48.84 per square foot per year, office rents in Oakland remains 29 percent cheaper than in San Francisco, down from 50 percent cheaper at the end of 2014 when we outlined why Oakland was at a tipping point with respect to demand and growth.

Too bad C&W has its SF chart in $/sf on an annual basis, whereas the Eastbay is monthly. I won’t be so (over)sensitve as to suggest it’s to make the latter look even smaller, but whatever the reason, it makes comparing them less intuitive.
The annual or monthly standard varies from market to market. The market standard in San Francisco is to quote on an annual basis. Other cities that quote annually include New York City, Boston, and Chicago among others. However, most West Coast markets quotes on a monthly basis.
There is no ulterior motive to make Eastbay rents appear smaller. The majority of the rest of the Bay Area quotes rents in $/sf/mo, with exception of San Francisco proper and perhaps a few outlying areas. In other words, this chart showing quarterly East Bay rent and absorption is in the language that is most translatable to stakeholders, participants, and industry professionals in the East Bay.
A similar chart for San Jose, the Peninsula, C&W’s definition of the Valley, or other markets that use $/sf/mo in local industry-speak would quote rents the same way. SF quoted rents mirror the way rents are quoted in nationwide comparisons and in material meant for a national or international audience. Don’t ask me why some markets do some things differently. To that end, SF rents are often a little more complex than office rents in other markets. As tech has taken over the downtown landscape, increasing employee densities in buildings and requiring greatly increased HVAC capacity for server rooms and more people, SF office sector was one of the first if not the first to see landlords all start implementing modified leases whereby landlords bill tenants separately for such things as utilities and janitorial, and these items are not baked into a “gross” lease. Now it appears that the city is poised to be on the forefront of cities with landlords converting over to “net” leases whereby the base rent is lowered and all of the pass throughs are billed to the tenant separately, rather than estimated in advance and then baked into total rent.
Basically, finding uniform standards for reporting things as seemingly simple as rent is a difficult if not impossible task. Just as one can easily multiply the table above by 12 to get the annual equivalent to compare to the city across the bay, one can mathematically convert quoted modified or net lease rents to gross rents, and at times especially when comparing multiple tenants in a single building, let alone multiple buildings or a whole market, or markets, that is as much an art as it is a science. Individual markets will continue to adhere to their own reporting metrics in order to best satisfy/serve their participants. What suits one may not suit another.