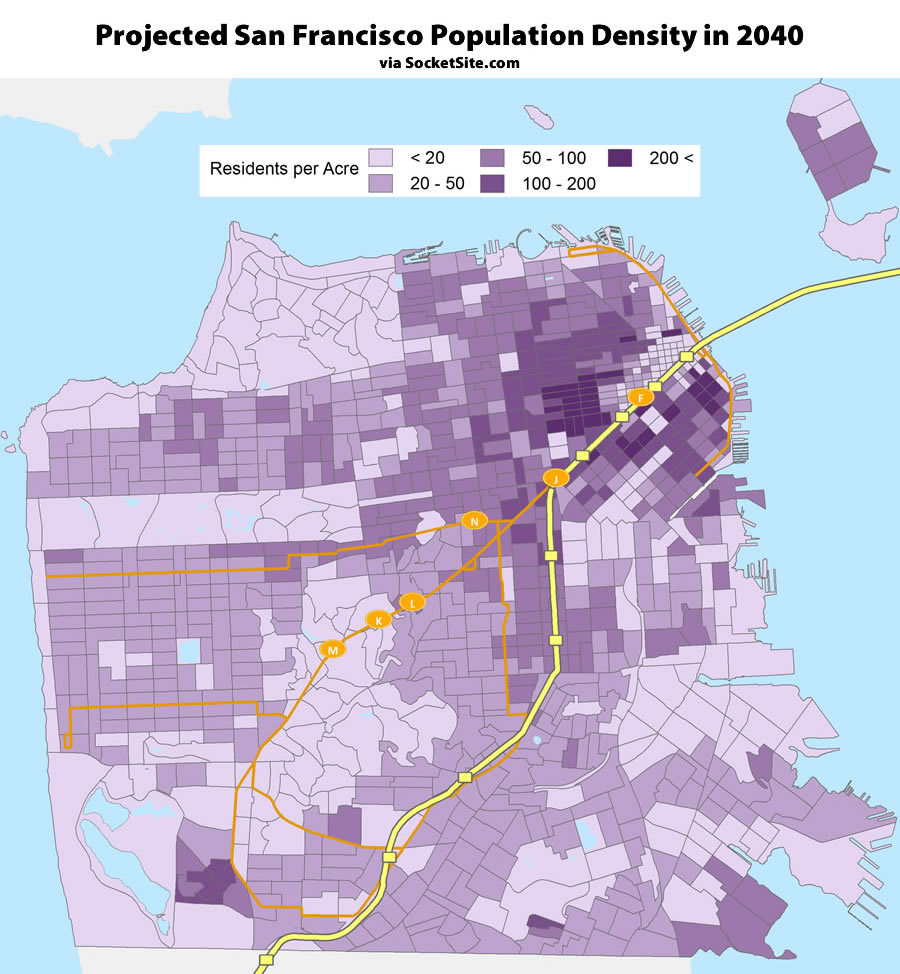
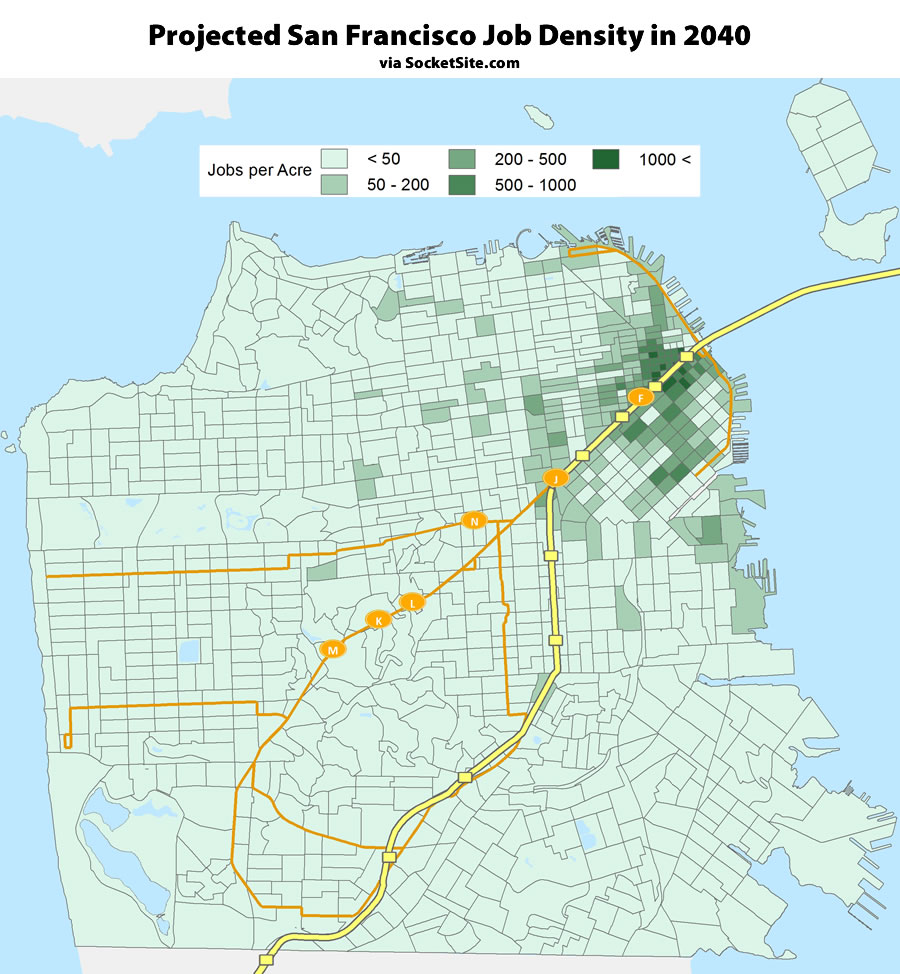
Taking into account current neighborhood populations and commercial corridors, along with the pipeline of residential and commercial development and neighborhood plans for growth, such as the Central SoMa Plan, the City has mapped San Francisco’s projected population and employment centers circa 2040:
Cool. Would be nice to see a more granular map so we can see street names…
So… they forgot the T Muni line. I knew it was going to take a while, but I kinda thought it would be in place by 2040.
Yeah WTF?? Also odd that they omit major bus routes that carry as many people as some of these light rail lines (e.g. the 38 lines have more boardings than any of the light rail lines, the 1 and 14 carry more than the J, etc).
I’m hoping this was just some amateurish summer intern work. Presumably a professional effort might account for publish transportation, and anticipated public transportation investments.
[Editor’s Note: Wait for it…The City Seeks Your Vision for the Future of SF’s Subway Lines.]
I’ve heard that the relevant departments at City Hall have formed an Interdepartmental Committee to address the issue of the lack of a T line in this map. The Committee has formed Working Group which will report back to the Committee after soliciting public comment via a series of neighborhood charrettes. So we should expect an updated map within two years.
Would be interesting to see the equivalent map today.
Err.. kind of looks like where most SF’ers live today…
Also looks like how it was 50 years ago 😐
Why isn’t Seattle on the map?
Or Portland?
…because they both suck. For the people who can afford to live here, they will.
These maps demonstrate the flaws of the southwest SOMA zoning. Right in the middle of the city and adjacent to transit. Surrounded by density, but neither a residential nor an employment nexus.
The low-population density of SW SoMa is due to the land occupied by the freeways not the zoning. And that area is not “adjacent to transit” in any effective way. It has crappy bus service. More residents of that area commute to work by car than by transit. And more of them either walk to work or work from home than take transit.
The transportation option that most distinguishes that area is the presence of two interstate fwys and multiple fwy ramps.
FWIW, that area is increasingly becoming both a residential and an employment nexus. It has one of the greatest concentrations of new housing under development in SF, in particular the beast at 8th/Harrison and the pile assembling along Brannan between 7th and 8th.
the western SOMA plan is literally the worst piece of nighborhood planning ive ever seen. it should be torn up immediately and that area upzoned to at least 12 floors
Certainly the homeless population in Golden Gate Park is greater than 20 per acre.
No doubt. And if you count all the unemployed hipsters living in the dunes at Ocean Beach, surely the Great Hwy goes a deeper shade of purple.
What a useless thing is that map.
Agreed – too blocky to be of real use. And out-of-date too; doesn’t show the T-Third line, for instance. (Though maybe they know something we don’t – the T-Third line gets destroyed in the great quake of 2021?)
So nice that there’s zero correlation between residential density and transit lines in the western and southern halves of the city… (and note that this map doesn’t show the T-Third!)
For example, why is the Richmond slated to be denser than the Sunset, which has 2 separate Muni lines? Why is there almost no density along the outer K / L / M lines, other than Park Merced? So ridiculous.
The Richmond is already denser than the Sunset. For both those areas, this map merely reflects the projected slow population growth there, maybe ~10% more people by 2040. While the SoMa through Bayview area could double in population by then.
Ah, so planning by blind extrapolation, then.
Again, socketsite does not link to its source. So we’re all just expected to believe that this map represents what socketsite says it does.
And having mapped San Francisco’s projected future population and employment centers for background, the City is about to seek your vision for the future of SF’s subway lines.
The great earthquake of 2037 might change the map a little… The areas on landfill and the sinky millenium skyscrapers might end up be lower density. The areas built on bedrock higher density….
2037? Try 2017 to 2020, 2027 at the very outside limit.
Though a lot of buildings will be condemned, they will be razed and replaced. I think the Big One will insert a 10-20 year pause in the Bay Area’s growth. It certainly won’t stop it.
I expected a much higher anticipated density along the southern waterfront.
Much more useful map including T-third.