As we wrote this past May:
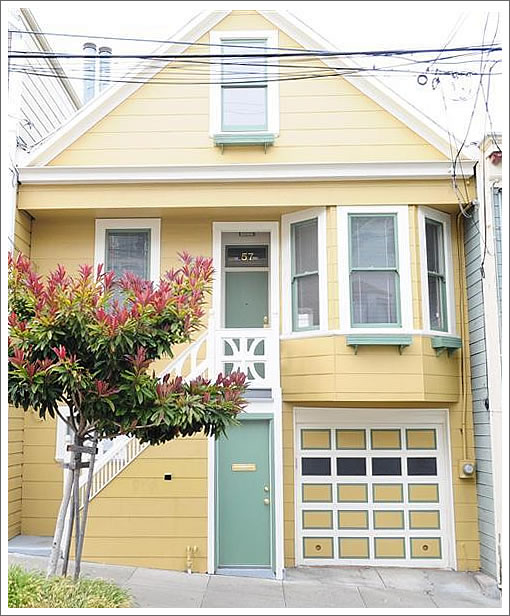
Purchased for $725,000 in June 2004, the 1,165 square foot 57 Bessie was listed in 2007 asking $849,000 before being reduced to $749,000 and then withdrawn from the market.
The single-family home on the northern (relatively) flats of Bernal Heights is back on the market today seeking a short sale at $695,000.
The property had also been listed in 2006 priced at $895,000 before being reduced to $829,000 and then withdrawn noting: “Final week!”
And while the MLS was just updated, the sale of the single-family home at 57 Bessie closed escrow two weeks ago with a reported contract price of $633,000.
Call it $543 per square foot and 13 percent under its 2004 sale price on an “apples-to-apples” basis for the remodeled North Bernal home on a small lot (as it was before).
∙ Whoa, Bessie! [SocketSite]
∙ Last Chance For Bessie? [SocketSite]
13% under the 2004 price. I feel like we’re in the book Time’s Arrow or maybe Slaughterhouse Five. As time moves forward, home prices move backwards.
I noted in the May post “as a general proposition that Noe has retreated back to about 2006 pricing while most of the city is back to about 2004 or a little further.”
Now, 8 months later, it’s more accurate to say that most of the city is at about 2003 prices or a little further, with Noe at about 2005 or maybe still 2006.
I think this is a good example of how not every property mythically appreciated after its last sale if that sale occured before 2008. In 2007 it could not sell for just 3% more then its 2004 price. Yet absent this documented attempt to sell in 2007, I am sure a lot of people here would have mentioned that it was probably down more then just 13% because 2004 wasn’t the peak, and this property likely appreciated after 2004.
Just a pet peave of mine about some of the comments here. IMO the “peak” of the market is more like the top of the hill, sure you can try to do precise measurements to find the absolute “peak” but there is instead a broad area where you can realistically say you are at the top of the hill, even if you aren’t standing at the exact peak. And 2004 was the top of the hill for this property.
In the same period median income in SF has creeped up 17-26% (household vs family), and CPI has edged up 15%. That 13% nominal discount over 2004 represents a 25% real drop.
This is evidence of what many have said for years- the deflation of the bubble will be part price erosion, part currency erosion. Not to take too much from a single data point, but the fact that the losses are this deep for 2004 buyers is a bit surprising.
real SF hasn’t taken a hit — and probably never will
^^^ I suspect that anon.edu is an impostor and not fluj.
A bit off topic but determining the “peak” is full of controversy, even in situations as transparent and well understood as geography : http://en.wikipedia.org/wiki/Topographic_prominence
fluj is now anon.ed, or was. No imposting here…just good clean fun 🙂
in any case fluj was more right and bears were more wrong. you guys don’t understand how things really work. It’s all very micro. (On it’s way to becoming nano.)
I seem to remember this going pending and then falling out of contract earlier last year. I remember that several people were very bullish on this place and thought it would go above the $695K asking, especially since it’s North Bernal. This is a great result for the seller, since this seems to be a small house with a minuscule yard.
I wonder what this says for 5 Elsie. 5 Elsie is currently listed for $769K after having dropped out of contract. It last sold at $880K in October 2007. The house is roughly the same square footage, same bedroom/bathroom count, with almost twice the yard, but still a small yard at 1746sqft.
The difference seems to be that 5 Elsie has usable space for the bedrooms, rather than badly done attic space. They must have gotten a tax value adjustment, since the tax value as of 2009 is listed as $700K, with 60% allocated to land and 40% allocated to the building.
It would be nice if you provided some statistical relevant data to make such a broad claim, “Now, 8 months later, it’s more accurate to say that most of the city is at about 2003 prices or a little further, with Noe at about 2005 or maybe still 2006.”
Data I have seen shows market pricing more like back to late 2004 or early 2005 prices City wide. See chart:
https://socketsite.com/archives/2010/12/san_francisco_recorded_sales_activity_down_178_yoy_in_n.html#comments
Case-Schiller we know is not a great fit for SF proper, but top tier probably is closest and seems to show about mid-2004 pricing.
https://socketsite.com/archives/2010/12/october_caseshiller_san_francisco_msa_value_slide_accel.html#comments
In any case, I always think it is better to talk SFR and Condos separately as they really are two different products IMO.
Let’s just look at D7 for last 10 years:
SFR
Year Median % YOY Change
2000 $2,270,000
2001 $2,500,000 10.10%
2002 $2,105,000 -15.80%
2003 $2,312,500 9.90%
2004 $2,725,000 17.80%
2005 $2,800,000 2.80%
2006 $3,100,000 10.70%
2007 $3,500,000 12.90%
2008 $3,275,000 -6.40%
2009 $2,700,000 -17.60%
2010 $2,962,500 9.70%
(At 2005/2006 pricing)
Condos
Year Median % YOY Change
2000 $710,000
2001 $781,500 10.10%
2002 $672,500 -13.90%
2003 $709,000 5.40%
2004 $820,000 15.70%
2005 $879,500 7.30%
2006 $937,000 6.50%
2007 $1,075,000 14.70%
2008 $1,095,000 1.90%
2009 $901,500 -17.70%
2010 $960,000 6.50%
(At 2006/2007 pricing)
Now if you look the worst performing district, D10 you see a much different story:
SFR
Year Median % YOY Change
2000 $368,000
2001 $410,000 11.40%
2002 $449,500 9.60%
2003 $494,000 9.90%
2004 $588,500 19.10%
2005 $675,000 14.70%
2006 $698,000 3.40%
2007 $670,000 -4.00%
2008 $560,000 -16.40%
2009 $510,000 -8.90%
2010 $480,000 -5.90%
(At 2002/2003 pricing)
Condos
Year Median % YOY Change
2000 $300,000
2001 $335,000 11.70%
2002 $341,145 1.80%
2003 $365,000 7.00%
2004 $439,000 20.30%
2005 $526,000 19.80%
2006 $535,000 1.70%
2007 $488,000 -8.80%
2008 $443,000 -9.20%
2009 $382,000 -13.80%
2010 $320,000 -16.20%
(At 2000/2001 pricing)
Both SFR and condo median and average prices in D5 (Noe’s district) are also at about 2006/2007 pricing levels.
[Editor’s Note: Apples, Schmapples, Look At Those Medians! (Just Not Too Closely). Or if you would prefer: Medians Are Up, But Don’t Confuse That With Increasing “Prices”.]
I’m going to guess that peak pricing for this house in 2006/2007 was probably around $799,000 give or take $10,000. Initially listing it at $895,000 was a really poor decision that ultimately cost the sellers in the long run.
Overall $725,000 to $633,000 is not a great outcome but considering it’s a short sale I would not consider this a complete disaster. (There have been worse outcomes in the SOMA condo market and some outlying areas in the city like Excelsior, Bayview, Ingleside etc.)
I will also say that standard disclaimer applies to noise in data, mix, etc. on the medians I posted above as data sets are not huge (typically 100-200 elements). My point is still that I have not seen any relevant data to suggest all of SF is back to 2002/2003 pricing levels. I would also argue that such a broad metric is not that interesting as well, but that is a different discussion.
“I have not seen any relevant data to suggest all of SF is back to 2002/2003 pricing levels.”
Yes you have! Just look at the subject of this thread – sold at 13% under the 2004 price. You’re just choosing to ignore the data you don’t like.
To the extent you’re hedging with the “all of SF” qualifier, then I agree that some neighborhoods have done a bit better and some a bit worse. How about you post your median chart with citywide numbers since that what I was talking about?
One last point, take your median chart and adjust for inflation and see where you end up. I was talking nominal pricing up above, but if one (properly) uses real pricing then even your numbers show things to be even worse.
He shouldn’t be using medians at all, adjusted for or unadjusted for inflation. We’ve seen time and time again that medians aren’t prices.
He’s just trying to shift to a statistic he thinks is friendlier to his cause, in spite of the fact that it’s less accurate, which is his whole point.
If you do like broad metrics than this chart showing 3 month moving averages probably gives the best overall view of SF RE pricing trends IMO as it factors out some of the noise. http://rereport.com/sf/charts/pvs_sfr.gif
You clearly see peak pricing in mid-2006 through mid-2008 and then big drop and then pricing leveling off for last 18 months or so with some smalls bumps along the way.
[sarcasm on]
Also, I’m going to change my tune and say that the mix has changed dramatically in 2010 versus previous years and that more “lower priced” units are selling, especially all the REOs and short sales we see posted here on SS. Statistics show that REOs sell for $300k less than owner sales on average (average of median price over 2010). Therefore, “pricing” is actually up in 2010 versus 2009 because of this change in mix. Of course, I have no accepted mathematics to substantiate this claim, but it does sound logical so it must be true…
[sarcasms off]
I’m really surprised that 5 Else hasn’t sold yet. I was looking to buy in Bernal for awhile and thought 5 Else seemed like a real deal – north side of bernal, near the top of the hill. I saw it and it is a pretty decent place. 57 Bessie has all sorts of weird issues – the lot lines are bizarre, there is no back yard, and half the house on the inside looks like its unwarranted. (Ultimately, we decided not to buy in SF since we aren’t sure how much longer we are going to stay in town)
There’s less appeal to being “near the top of the hill” on the north side of Bernal, since you’re still several blocks away from the Cortland strip. Unless you really want views, houses closer to Precita Park and transportation may be better values than 5 Elsie.
“Also, as a math major, I will add to my comment above that statistics and data don’t tell the entire story.”—- Skirunman April 26, 2010.
“I’m actually a math and comp. sci. guy.”—- Skirunman August 13, 2010.
“I have an a degree in Mathematics and understand statistics and probability theory.”—- Skirunman December 17, 2010.
Over the past few months, I have observed the repeated systematic and logical shredding of your muddled,”math based” arguments by a decent and not insignificant number of pretty damn intelligent Socketsite posters.
Particularly hilarious was the way tc_sf recently illuminated the fact that you don’t even truly grasp the concept of “standard deviation”.
I mean, even humanities majors who most definitely aren’t “math guys”(or gals) generally understand this most elementary concept when they take Statistics 1.
[sarcasm off]
Which leads me to ask. Did you major in math at a junior college? Or was it DeVry or ITT Tech?
[sarcasm still off]
[sarcasm on]
3581 Clay Street sold for $3.5M on 8/17/2004 and then again $3.48M on 1/29/10 and was remodeled in 2002. Quod Erat Demonstrandum: all of SF RE pricing is at 2004 prices. Now don’t ignore my compelling data A.T. and tipster.
OR
3041 Laguna sold for $3.25M on 5/14/09 and then again for $3.3M on 4/20/10. QED: all of SF RE pricing is flat YOY.
[sarcasms off]
Come on guys, 57 Bessie is one data point out of thousands.
“3581 Clay Street sold for $3.5M on 8/17/2004 and then again $3.48M on 1/29/10”
Uh, OK, so you mean we’ve only fallen back to 2004 prices (actually slightly under – and that’s in nominal terms) rather than 2003? I suppose that is a credible position. It’s the one I asserted in May. That does not really support the 2005/2006 pricing hypothesis indicated by your median charts, does it?
Guys…does anyone really care if average/median prices have fallen 20% or 25%?
I say that SF prices are down pree-cisely 22.78% and are now back to October 2005 levels. Second week of October ’05, in fact. On Tuesday. Roughly 2:42PM. Prove me wrong. Using fractals.
I guess I just don’t understand the obsession with false precision.
@nnona: aha, the old Ad Hominem attack when you don’t like the logic, so sad. Actually tc_sf did not, and I will paraphrase, “illuminate the fact that I don’t grasp the concept of standard deviation”. If you go back and read that thread closely you will see that I said “I have simplified my response below” in regards to my post on Cochran’s (1977) theorems to El-D and SFR and tc_sf misinterpreted my statement “+/- 3 standard deviations of mean”, which I admitted was not clear in my attempt to provide a short response. Are you happy now?
@A.T.: I hope you were being sarcastic when you said “…OK, so you mean we’ve only fallen back to 2004 prices…”.
@LD: I agree it is not so important if we are at 20% or 22% or 25% off the “mythical” peak pricing, but I think it is interesting and important to try to understand the pricing trends, which does require use of statistical measures and not just SS selected apples.
In any case, my attempt to provide some more logic and statistically analysis to SF RE pricing here on SS seems to offend some people, which I frankly don’t understand.
“That does not really support the 2005/2006 pricing hypothesis indicated by your median charts, does it?”. Actually it kind of does as the market is made up of both apples and non-apples. RE in D7 especially gets updated all the time. Just take a drive around Pac Heights and look at all the remodeling going on. I personally am not so interested in trying to calculate an ROI on an apple I don’t own, but instead trying to understand market transaction pricing trends in areas for future investment.
“RE in D7 especially gets updated all the time”
Bingo! You see why comparing non-upgraded medians from several years ago to upgraded medians of 2010 is not particularly meaningful? Apples to oranges?
Skirunman, I understand medians and averages and statistics generally, and median sales data is one piece of information regarding the market. But with heterogenous, varying samples of SF listed sales, it really is not useful for anything other than knowing the median sales price. Maybe that is all you care about. Fine. But I am far more interested in figuring out how a piece of property is likely to have appreciated or depreciated over time. If one is buying or selling a place, that is far more useful. Real world examples of actual properties that sold twice or more are better indicators of the market trends I care about.
“Real world examples of actual properties that sold twice or more are better indicators of the market trends”
But I always come back to why? Why are some properties sold and resold, and are they really a good guage of the market. I don’t think they are. They are flawed properties that keep getting more lived in.
I like looking at what a total fixer is going for, not the same house but generally the same shape, location and lot size. That tells me a lot about the market.
Bears and Bulls always project the worst and best case scenarios and can always find a trend in the data that supports it. In between are folks that call the market as it sits today.
@Skirunman, nnona: While I certainly don’t want to get into an Ad Hominem credential fight with anonymous people on a blog, my intention was to politely show that much of what Skirunman was asserting related to the use of statistics, Cochran’s rule and standard deviation was quite incorrect. Not merely “simplified”.
It is worth noting that confirmation bias, the tendency to cherry pick data that confirms our beliefs, is fairly common in all of us. The undeniably brilliant Isaac Newton was reputed to have lost a fortune in the South Sea Bubble. With the availability of mean, median, repeat sale, nominal, inflation adjusted, Seasonaly adjsuted, $psf,… data there is a wide range of data to look at and find something to confirm your beliefs.
This is why I am fond of the car example of why median’s are not a good measure of prices from an owners point of view. Nearly no one has a belief that the car they buy today will be worth more 5 years from now.
Similarly, if I tell you that a drug company claims a drug will leave your cholesterol “basically flat” with a certain standard deviation and an anonymous tipster shows up with documentation that 10% of the trials show cholesterol levels elevated past 6 standard deviations, any reasonable person would agree that something is wrong. Even if the documented trials are not picked randomly and the tipster has shady unscrupulous motivations.
But in the above if you substitute houses for cars and drugs, then people get irrational.
@Legacy Dude — I agree completely that we should not look for too much precision in RE data or analysis. There seems to be quite a chasm between camps on some points, so arguing over a few percent here and there doesn’t seem productive.
@tc_sf: I appreciate your tone and thoughtful response. I chose not to respond to your last post on the thread we were discussing Cochran’s (1977) formulas as you had misinterpreted my calculations, probably based my my “simplified” posting. However, I believe my calculations and use of Cochran’s formula to be correct when trying to “design a survey” for apples. I will try to provide a detailed response on that thread a bit later.
I agree that medians, or really any statistical measures, are “not a good measure of prices from an owners point of view.” However, in this context we (I?) are not discussing individual owners, we are trying to analyze market pricing trends.
I accept apples for what they are and I accept statistical measures (median, mean $/sf, etc.) for what they are as well, that is all. However, as I have said ad nauseam, IMO I do not believe that the “apples” presented on SS to portray accurately the state of SF RE market pricing trends.
The chief factor at work here was last sale, no tenants, this sale, tenants. And a short sale agent whose showing directions were, “call the tenant and leave a message 30 minutes before showing.” Bet that worked great. Also, did they or did they not stick a tenant into the unwarranted space? It sort of seems as if they did judging from the rent figure, $3100 … 2K for the tiny house and 1100 for the inlaw? Plus the renters are partyers and smokers. http://www.sftu.org/omi.html Nothing will diminish a first time buyer demographic like the thought of still more buyout money. And if the inlaw was separately occupied? Triple the negativity.
I thought owning re with tenants was supposed to be a gold mine? You know, rentier lifestyle, sitting back and letting the rent checks flow in?
yes, it’s all the pot-smoking, partying renters fault. they probably even cooked in the kitchen 5 days a week and used the bathrooms
diemos,
that rentier lifestyle involves some work too. for instance you have to haul those sacks of money from place to place. plus, you need to find a place to invest b/c letting your savings get eaten up by fed inflation is untenable.
Well, at the recent sale price, it looks like the owner will have to haul a few hundred a month out of his checking account and not into it (properly factoring in all costs). But at least that is a lot less “rent down the toilet” each month than the 2004 buyer was losing. Looks like the tenants are the most financially savvy players in this game.
If somebody bought it to hold it with a couple hundred down and no intention to move in, then sure, I guess it’s cash flow positive. Probably unlikely though. More likely first time buyers and see http://www.sftu.org/omi.html . As to the tenants the sidewalk is always strewn with cigarette butts and trash so draw your own conclusion.
no, ninnee is right. rents are going up…ninnee is seeing increasing demand for certain segments. why not let renters pay to build your equity? i’m calling my broker to see if i can take some equity out of my house to buy a multi-unit “good building in a good sf nabe”.
ninnee, didn’t you tell us the other day it’s a “deflationary world”? Or is the “fed inflation” eating up our savings?
“How about you post your median chart with citywide numbers since that what I was talking about?” A.T., I tried to post two links to a bunch of interesting graphs, but the post was flagged by SS algorithm for some reason. Hopefully Editor will approve and re-post as I think many will find data interesting no matter what your take on medians. Citywide: SFR Medians 2009 =$745k, 2010=$750k; Condo Medians 2009=$670k, 2010=$670k
stalker dude,
have it your way. yes i believe its a deflationary world. but we all know some things are going up (food, energy…rents).
so tell us, stalker dude, where you think money will do well? sitting in cds? the fed is forcing people into risk assets and punishing savers so what to do?
buying super low cap rates is not a good idea either, i agree.
oh, it’s a deflationary world. so i shouldn’t be so quick to call my broker and load up on debt right now? well, at least “fed inflation” is not into eating into my savings.
maybe i’ll wait until i start to see 1-2 year apples not falling like, well, apples before i buy.
skirunman,
let me show you my problem with medians with an example that i posted previously in another thread.
these are two different houses in bernal, on the same block, selling two years apart. one sales is closer to the peak of the bubble.
here’s a 3/2 1372 sq ft house sold 7/16/2008 for $1.31M.
http://www.redfin.com/CA/San-Francisco/98-Anderson-St-94110/home/2019570
2 years later 4/3.5 2400sq ft house, a half block over sells for the same price!
http://www.redfin.com/CA/San-Francisco/255-Moultrie-St-94110/home/762142
On a psf basis, value may have fallen as much as 40% but the median will say nothing about that.
Now, you may say, use psf numbers. At the peak of the bubble, houses on the busy streets or those looking into walls or layout issues were selling just as well as pristine houses in pristine locations. psf medians will say nothing about that. Values can fall but medians can hide them.
I like apples.
Medians SFR($k) ChgYoY Condos ChgYoY
2010 750 1% 670 0%
2009 745 -9% 670 -12%
2008 821 -8% 765 -1%
2007 895 6% 770 5%
2006 841 0% 730 1%
2005 838 12% 726 16%
2004 750 19% 625 17%
2003 630 7% 535 2%
2002 590 5% 525 5%
2001 560 6% 500 -8%
2000 526 26% 541 35%
1999 417 15% 401 18%
1998 362 18% 340 20%
1997 307 12% 284 7%
1996 275 4% 265 6%
1995 265 2% 250 -2%
1994 260 -3% 255 5%
1993 268 243
Total % Chg 113% 114%
Annualized 7% 7%
Off -16% and -13% respectively for SFR and Condos from peak year. I don’t believe mix in SFR has changed dramatically over this time in terms of different or new product, but certainly condo has with all the new development in SoMa including new luxury product. Based on this data, as well as well as other data I utilize, it is still my contention that market pricing is likely down 15%-20% on average from peak City wide. Is City wide pricing data that useful? Not really IMO as I have stated before, but it does make for good sound bites. I’ll chant the SS mantra “medians are not pricing” though just to make the SS Editor happy 🙂
that’s it then stalker dude? if you believe a.t.’s frequently posted inflation figures then it looks like you will be losing money by sitting still. how is the purchasing power of your savings going to keep up?
“yes i believe its a deflationary world.”
make up your mind, ninnee. either it’s a deflationary world or i have to worry about keeping the “purchasing power of my savings”.
@YEWBA: I agree with everything you said, but I don’t use medians or mean (not median) $/SF data as my only analysis when buying a single property. I use this data, along with other data I collect, primarily for market transaction pricing analysis, i.e. macro trends. Specific situations as you point out become lost in the noise with large data sets. When analyzing a specific property all the other items come in to play such as specific and relevant comps, motivation of the seller, projected ROI analysis on the property, etc.
What I have been trying to say is that a specific apple (or 10-20 apples for that matter) does not necessarily tell a good story either when trying to understand the larger market. It would require a statistically significant analysis to be done using apple data to make this logical leap with any pretense of accuracy. Also, as sparky-b has hit on, I believe apples on average to be more likely lower value properties within their sub-market so they likely don’t represent the overall market accurately anyway. This is just my opinion and I don’t have objective data to prove this point so it is moot.
For instance, IMO it would be just as flawed logic to say “median pricing is down 15-20% for all of SF RE off the peak so this specific house must also be worth about 15-20% off its peak value” as it would be to say “apple-1 just sold for 25% off of its 2004 pricing so all apples (or worse all SF RE) must also be worth about 25% less than their 2004 value”. I personally never make the leap from median to specific property, but it seem many folks on SS do try to make the leap from single apples to market pricing.
I’ve come to the conclusion we all have different motivations here so trying to discuss this issue rationally is most difficult. I think I will give it a rest especially as I have a new project starting next week. I’ll look forward to it being highlighted on SS in the future as was my last project this last November. It is always fun to read the comments.
true, skirunman, that you can’t take an individual apple or a set of apples or median changes and generalize that city wide etc.
i always enjoy your posts and the spirited discussion it generates. good luck with the new project, and look forward to reading about it here.
“I personally never make the leap from median to specific property, but it seem many folks on SS do try to make the leap from single apples to market pricing.”
Can’t speak for anyone else, but it doesn’t seem that hard to determine a rough range the market is up or down from apples over the aggregate. The fact of the matter is that very few people actually make a compilation of apples, although the exception from what I understand is the Manhattan Beach real estate blog. Using a sufficient number of apples, you can certainly hazard a guess of the state of the market overall and be rather accurate.
Some commenters here overemphasize the belief that an individual property is unique. The real estate industry’s incentive is to overemphasize uniqueness as a nexus to a higher price.
However, most houses even in the city and county of SF, are easily replicated and probably have been replicated already. Moreover, uniqueness to one person doesn’t mean that another person will find the same value in that alleged uniqueness.
Really what people are saying is that “to me, this particular aspect of the property is worth a lot of money.” However, asserting that a particular value-judgment should be important to everyone is making the same categorical error as assuming that every single house is interchangeable.
Apples account for the fact that housing may not be interchangeable because it’s the same damn house. I’m not buying sparky-b’s red herring about a few extra years of wear. It’s one thing when we’re talking about grandma’s unrepaired for 30 years house vs. a recently remodeled apple with essentially a fresh coat of paint and not much else.
“for instance you have to haul those sacks of money from place to place”
Remember to lift with your knees, not your back.
It not a red herring, it’s a fact. You can value it how you want, 99% of previous value if you like. I value it lower. Plus, I think there is a “new car smell” that drops off after the first sale, but lots of apples aren’t that either. They are sold and resold and resold, why is that? It’s because there is something wrong with the place compared to the house next door (for example) that has it coming to the market again and again.
I am not saying it’s gramdmas old house where she never fixed the roof and lived in one room. That gets into the total fixer area, which I do think is a good marktet indicator.
Here’s one for you that people like to do for each new sale; Refinish The Hardwoods. The ’00 person did it with the kitchen, resold in ’04 and ’10 with shiny new floors. They were installed a long time ago and were probably refinished in the ’60s and ’80s. They are 5/16″ thick to start with, there is nothing left. The new buyer can’t refinish them even though the last owner put an ugly super high gloss on them. The new buy has to rip them out and pay for all new hardwood and baseboard and casing and painting. The house may not look like it’s worth less but it is.
“The new buyer has to rip them out and pay for all new hardwood and baseboard and casing and painting. The house may not look like it’s worth less but it is.”
That’s fair. But isn’t it equally plausible that the seller of the “apple” already did this type of work (un-permitted so no public notice) so the new buyer is actually getting a better place than the apple seller bought? We’ve done all sorts of relatively minor work like this on our place over the last 10 years – faucets, floors, shelving – in addition to a kitchen remodel w/ permits. Can’t draw any broad conclusions given that both possibilities are equally likely. Over the last 20 years or so, SF housing tends to be upgraded rather than neglected.
This kind of stuff is immaterial anyway given the several hundred thousand dollar price declines we’re seeing on recent apples these days. Even a $20,000 new roof (on a big place) is only 2% of a $1mm home or 1% of a $2mm home
It’s possible, and it’s a made up scenario anyway. But it’s based on what I see in listing sometimes. Super shiny finished old floors. Most new floors would be 3/4″ T&G and a wider plank.
Your new shelves may be awesome but it’s where I want my buffet to go. I need to take them out and refinish the wall. And why did you put polished chrome fixtures in now I need to re-replace those with brass. You may think you added value, but did you really?
Again, I am not saying apples don’t have value. You point to a 2% discount. Okay, fine. My take is a bit more on average, that’s all I’m saying.
sparky-b : is there an easy way to determine hardwood floorboard thickness ? All I can think of is to drill a hole which is frowned upon when touring an open house (you have to wait for a private tour for that).
i agree with sparky that there is a reason some houses keep coming to market. people try to overcome flaws with their ‘great’ sense of design and hope they will be able to trade up. this plan does not seem to work when the market is heading south.
There is usually a spot you can see it, a heat register can be removed. But there you have to look to see that the center isn’t sanded more than the sides. Also, you can look at the nails. If they are staining long that tells you something as well. A nail shot in at an angle will still look like a cirle as you sand and sink the nails (or sand them) they get longer. Also, this can be a sign of over sanding which given the starting thickness is a bad sign.
There are a host of explanations for homes coming to market again after just a few years other than “they must be problem houses” or “failed flips.” The owners can’t afford the bubble-era prices they paid, or they’re just tired of paying 3X-rent on a fast-depreciating asset, or job loss, or job re-location, or divorce, or illness, or 100 other life changes. I’ve heard (apocryphally) that the average hold is only 7 years, so 3-5 years (or less) certainly is not extraordinary.
You are welcome to your opinion I am just stating mine. I guess in the end what I care about more is the houses that don’t come back on the market. I am happy to say that no spec. house I have done since ’99 has returned to the market.