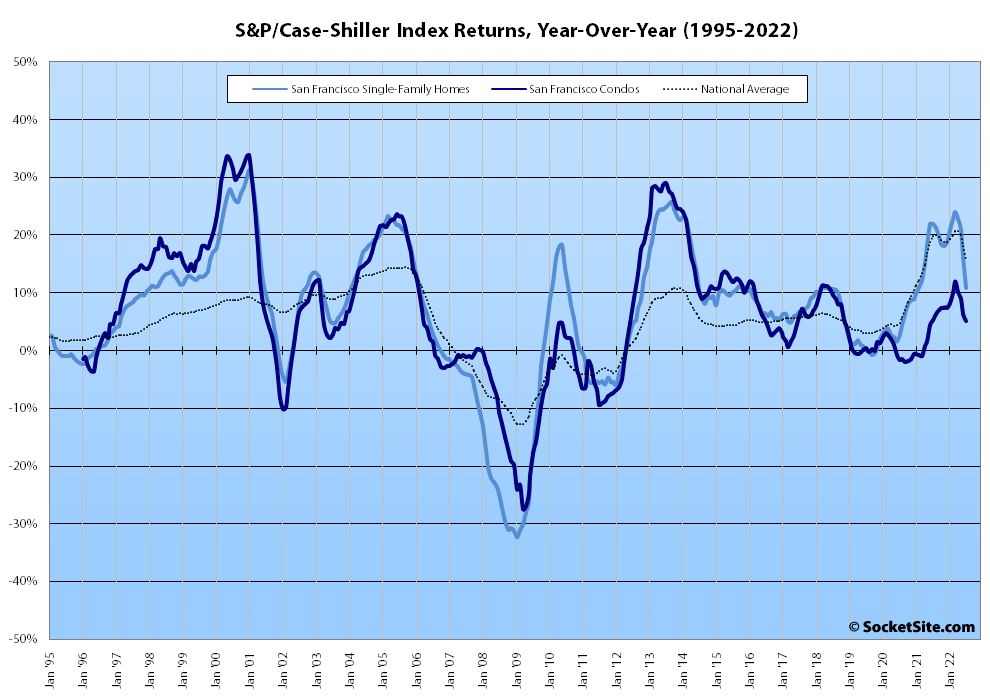
Having ticked down 1.3 percent in June, the S&P CoreLogic Case-Shiller Index for single-family home values within the San Francisco Metropolitan Area – which includes the East Bay, North Bay and Peninsula – dropped 3.5 percent in July, representing the largest month-over-month decline for the index since the first quarter of 2009. And while the index is still 10.8 percent higher than at the same time last year, it’s down 4.8 percent since May, has rapidly decelerated from a 24.1 percent year-over-year increase in March and is poised to soon demonstrate a year-over-year decline in values, none of which should catch any plugged-in readers by surprise.
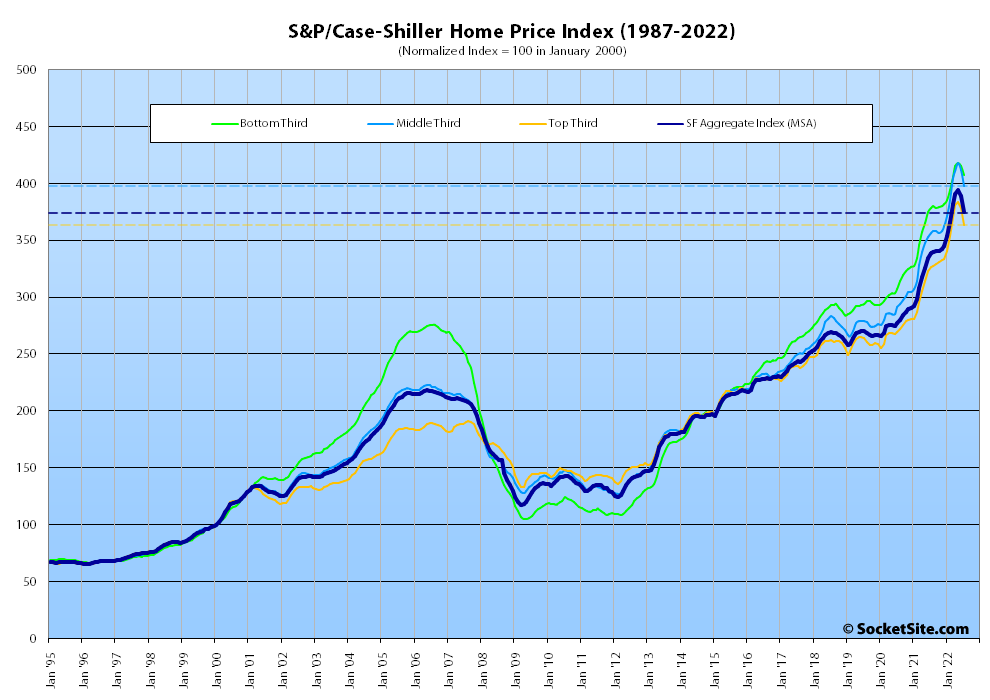
At a more granular level, the index for the least expensive third of the Bay Area market dropped 1.8 percent in July for a year-over-year gain of 7.7 percent; the index for the middle tier of the market dropped 3.5 percent for a year-over-year gain of 11.5 percent; and the index for the top third of the market dropped 4.0 percent for a year-over-year gain of 11.2 percent, down from 25.1 percent in March.
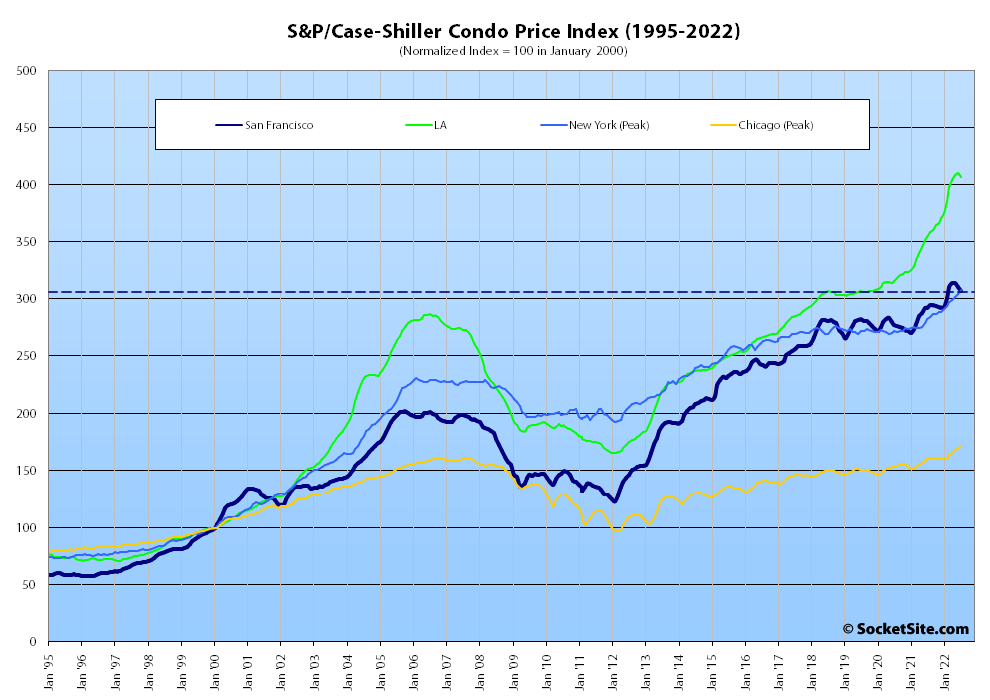
The index for Bay Area condo values, which remains a leading indicator for the market as a whole, dropped another 1.1 percent in July for a year-over-year gain of 5.0 percent, which was down from a localized peak of 12.0 percent in March and versus year-over-year gains of 14.8 percent, 7.0 percent and 9.0 percent in Los Angeles, Chicago and New York respectively.
And nationally, Tampa once again led the way with respect to exuberantly indexed home price gains, up 31.8 percent on a year-over-year basis, followed by Miami (up 31.7 percent) and Dallas (up 24.7 percent) but with a growing “deceleration in U.S. housing prices” and a month-over-month drop of 0.3 percent overall.
Our standard SocketSite S&P/Case-Shiller footnote: The S&P/Case-Shiller home price indices include San Francisco, San Mateo, Marin, Contra Costa and Alameda in the “San Francisco” index (i.e., greater MSA) and are imperfect in factoring out changes in property values due to improvements versus appreciation (although they try their best).
2021 will eventually be known as the biggest US economic bubble year in a long time, possibly ever. Everything inflated: houses, the stock market, crypto, consumer goods etc.
Agreed. All assets are suffering an inevitable inflationary fate from the debasing of our currency (as a response the the virus). Dollars were printed and M2 exploded. They would have printed more had Build Back Better not been stopped. Now the middle and lower class are screwed. Exciting times and all that money is not going back in the bag FYI.
While the rate at which the money stock (M2) increased was higher during the pandemic, in order to avoid an economic collapse, there were actually more dollars printed from 2010 through 2019, in response to the lending driven crash in 2008, the downturn for which started back in 2005.
All of which brings us back to the market at hand and going forward and versus a “Roaring 20s” that many industry folks were completely (mis)predicting and touting in newsletters and the press.
Yes, exciting times. But all that money, and more, is being destroyed before it even gets to the opening of the bag. FYI, falling stock markets have wiped out more than $9 trillion in wealth from U.S. households this year and we aren’t event at The Fed’s projected terminal funds rate yet.
That’s because housing is extremely overvalued. Has a long, long way to fall.
well, thanks to our supervisors artificially restricting new housing, i think SF fall will be muted to maybe less than 20%. the supply is still extremely limited. but im no prophet
Well, seeing as how around 30,000 units of housing were built and added to San Francisco’s housing stock over the past decade and over 50,000 units over the past twenty years, if our supervisors really were attempting to artificially restrict new housing, we can agree they failed.
Agreed. NIMBYs are losing the war. The pro-housing folks have infiltrated social media, Sacramento and everywhere in between. There is incredible awareness of the issue now, compared to even ten years ago.
SF will continue to crank out around 3K/units/year is my guess, for the forseeable future. This is below the peak boom years of ~5K/year, and well below what the “housing element” calls for. But it will still be very solid compared to historical norms.
2500/year is a pathetic rate. I think we can all agree they did succeed in strangling the market when production was far below 1% expansion per year, which is a typical rate for large cities.
Honest question: is it fair to compare all large cities when they vary significantly in density? Most large cities have lots of surface parking lots, empty lots etc which are easy to redevelop. SF has very few. Doesn’t that make it harder to build quickly? The local permitting process and general red tape has a lot to do with it as well, it doesn’t seem like apples to apples makes sense. For example, how much does Brooklyn grow per year? Boston?
I think we can all agree
they did succeed in strangling the market whenproduction was far below 1% expansion per year,which is a typical rate for large cities.a rate that’s well within American norms for large cities, given that this group includes fast growing cities, mostly at the smaller end – DUH!! ‘cuz it ain’t hard to grow percentage wise when you start out small – and basically stable burghs at the top end.So maybe we can’t all agree…..consensus appears to be overrated.
I have a building that had a Zillow estimate peak of 10.5m, now 5.3m. I know Zillow is unreliable, but I still find it troubling.
Lumping values for the 9 county bay area together never makes sense.
UPDATE: Drop in Bay Area House Values Is Really Accelerating