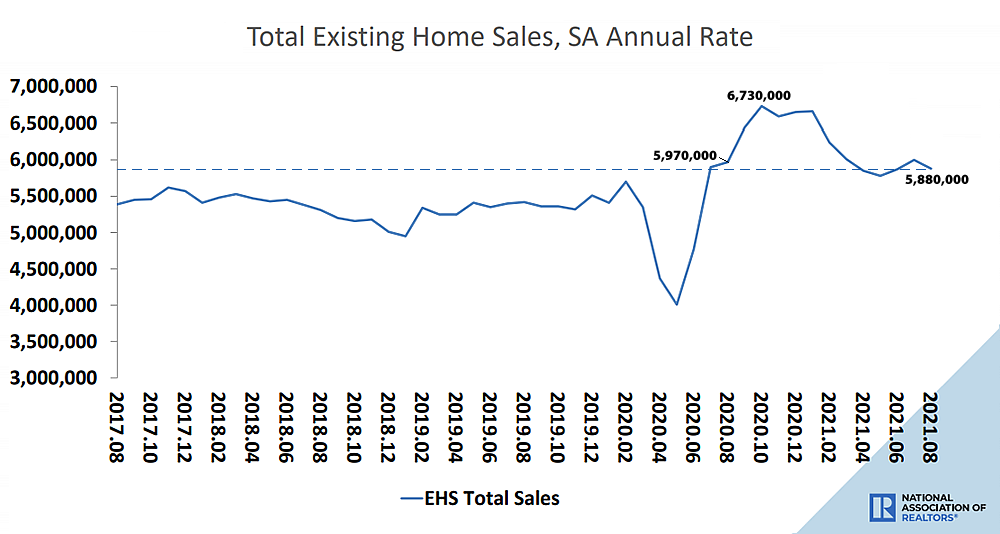
Having ticked up in July, the seasonally adjusted pace of existing-home sales across the U.S. dropped 2.0 percent in August to an annual rate of 5.88 million sales and was down 1.5 percent on a year-over-year basis, representing the first year-over-year decline in the pace of sales since July of 2020, according to data from the National Association of Realtors.
At the same time, while listed inventory levels across the U.S. ticked down 1.5 percent in August, for a total of 1.29 million homes on the market, and were down 13.4 percent on a year-over-year basis, inventory levels should tick up, versus having jumped in San Francisco, when the September numbers are reported.
And while the median existing-home sale price was 14.9 percent higher in August ($356,700) than it was at the same time last year ($310,400), the increase continues to be driven by a dramatic change in the mix of what has sold versus underlying and widely misrepresented “appreciation.” In fact, the median sale price actually slipped a percent from $359,500 in July and is down 1.7 percent from June ($362,800).


Pace of existing home sales *still higher than it was for the 30-month period pre-Covid*. A one-month myopic look back is no way to try to describe or decipher trends.
It seems to me that the late-covid bump pretty much offset (and represented) the trough of decreased demand in the early covid period. And now we’re returning to “normal”.
You’re right. Which is why we actually “look back” and provide context for the data over the course of years, in order to identify key inflection points and trends (such as the jump in the late 2020 sales having “pretty much…represented…the trough of decreased demand in the early covid period” versus having evidenced a sustained jump in demand and “hot, hot, hot!” market, which is an important distinction).
And on a related note: New Home Inventory Up 32 Percent in the U.S., Sales Down