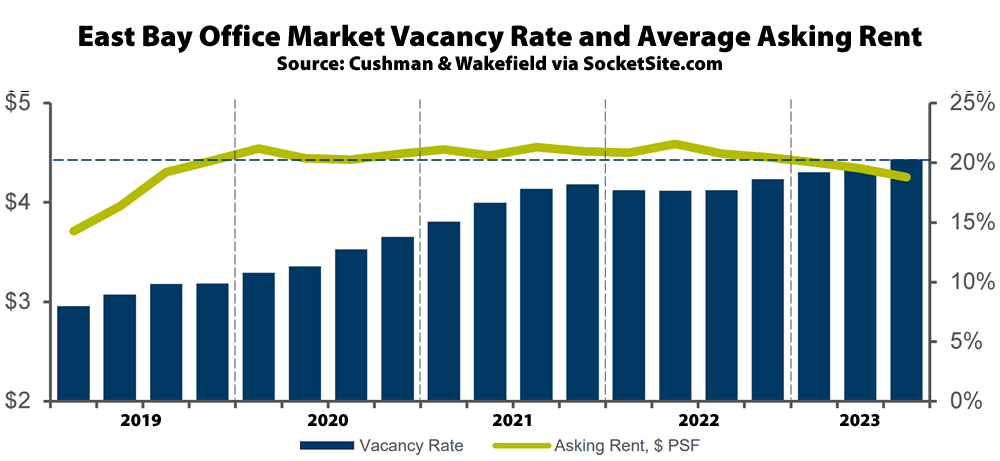
The office vacancy rate in the East Bay, not including Walnut Creek or further east nor life science/lab space, inched up 50 basis points in the third quarter of this year to 20.3 percent, which is over twice as high as prior to the pandemic but still well below the effective office vacancy rate in San Francisco.
In addition to 4.6 million square feet of un-leased and non-revenue producing space, the current vacancy rate includes an additional 1.1 million square feet of space which has been leased but is actively being offered for sublet, with an office vacancy rate of 37.6 percent in Oakland’s City Center Core, which is up from 35.7 percent at the end of June, according to Cushman & Wakefield.
At the same time, East Bay landlords are still trying to hold firm on asking rents, with the average asking rent having inched down 9 cents over the past quarter to $4.25 per square foot per month, which is only 5.3 percent lower than at the same time last year, with less than 180,000 square feet of space leased over the past quarter, negative net absorption of over 200,000 square feet, and properties starting to be handed back to the banks.
[Cushman & Wakefield] bifurcates DTO into lower (City Center) and upper (Lake Merritt) segments; and the rate in the latter is quite a bit lower (20.6%) So if the 37.6% was intended to represent DTO, it seems to be misleading – dare we say it ?! Cherry picking 🙁 . It seems, insofar as the two are proximately the same gsf, they might (simply) be averaged, in which case DTO ~30%…about like DTSF.
Agreed, the nomenclature used by Socketsite regarding these East Bay zones is a little hard to follow. It would be nice to have a map overlayed with the zones the editor is referring to and their vacancy rates, prices etc. This would a nice generalizable visualization that could be used for many things, such as the price per square foot in different neighborhoods of SF.
They’re somewhat dependent on following CW’s wordage : my (original unedited) post had a complaint about continued use of “City Center”, which is a specifc development – tho the Report doesn’t use it in that context. But the Report does (also) have a line item (Oakland CBD Total) which would seem like a more useful number…particularly if one wants to compare to DTSF. The fact that it’s less headline grabbing (28.7%) makes me think SS went for sensationalism….something I don’t normally accuse them of (nor need they, when the numbers are all this bad…on their own!)
Hilarity ensues with asking rents increasing in 2019 while vacancy rates also increased. Could it be that illiquid, speculative, non-fungible asset markets function differently than consumer good and commodity markets? Nah, couldn’t be: that would make my econ textbooks wrong!