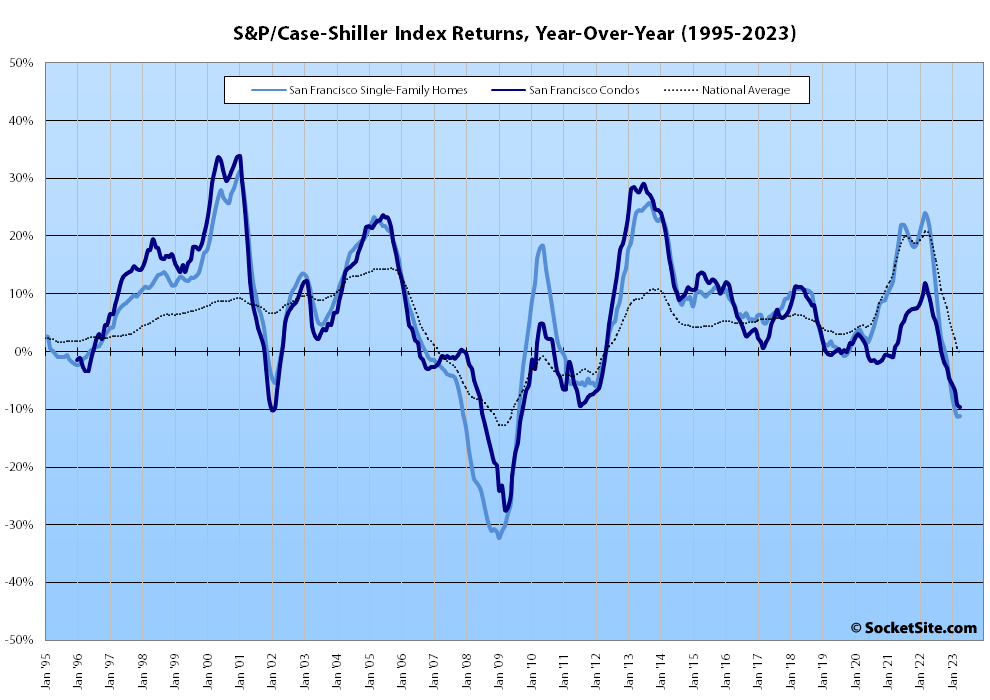
Having gained a seasonally driven 3 percent in March, the S&P CoreLogic Case-Shiller Index for single-family home values within the San Francisco Metropolitan Area – which includes the East Bay, North Bay and Peninsula – ticked up another 2 percent in April, half of which can be attributed to typical seasonally. That being said, the “San Francisco” index was 11 percent lower than at the same time last year and 12 percent lower than in May of last year, having ticked up 5 percent in 2023.
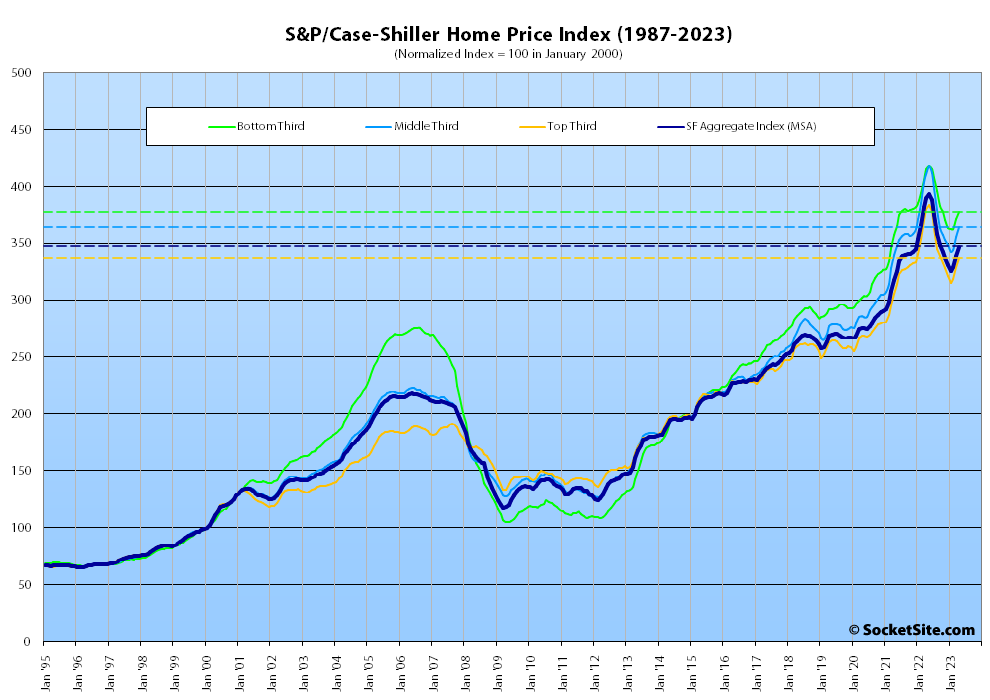
At a more granular level, the index for the least expensive third of the Bay Area market ticked up 1.8 percent in April for a year-over-year decline of only 9.0 percent; the index for the middle tier of the market ticked up 2.6 percent for a year-over-year decline of 11.4 percent; and while the index for the top third of the market ticked up 2.6 percent but with a year-over-year decline of 11.3 percent, representing the largest year-over-year decline for the tier since 2009.
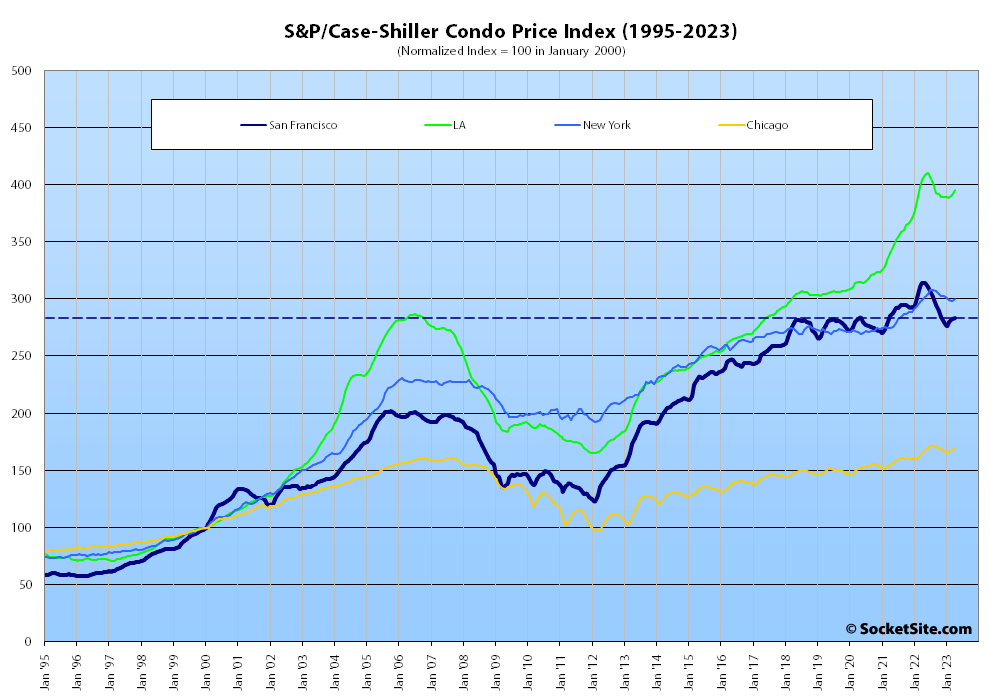
The index for Bay Area condo values, which remains a leading indicator for the market as a whole, inched up 0.5 percent in April but was down 9.6 percent on a year-over-year basis and from last May, with a 2.1 percent year-over-year decline for Los Angeles and New York holding on to a 0.5 percent year-over-year gain.
And while the national home price index ticked up 1.3 percent from March to April it slipped 0.2 percent on a year-over-year basis, marking the first year-over-year decline for the national index in over a decade, which shouldn’t catch any plugged-in readers by surprise, with Miami (which remains 5.2 percent higher than at the same time last year) continuing to lead the way with respect to exuberantly indexed gains, now followed by Chicago (up 4.1 percent) and Atlanta (up 3.5 percent), with San Francisco (down 11.1 percent) and Seattle (down 12.4 percent) at the other end of the spectrum.
Our standard SocketSite S&P/Case-Shiller footnote: The S&P/Case-Shiller home price indices include San Francisco, San Mateo, Marin, Contra Costa and Alameda in the “San Francisco” index (i.e., greater MSA) and are imperfect in factoring out changes in property values due to improvements versus appreciation (although they try their best).