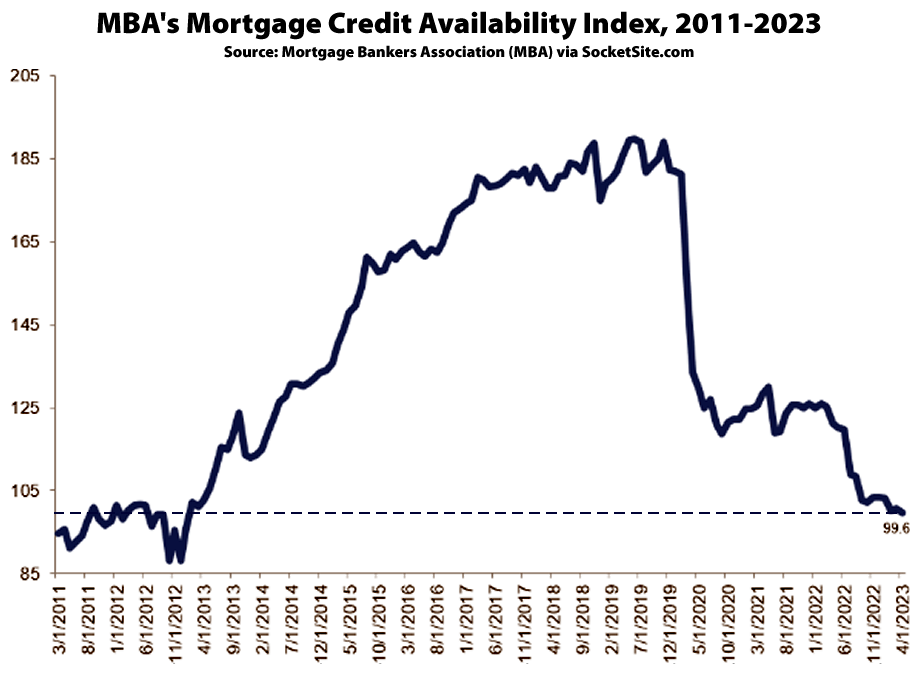
Having inched up 0.4 percent in March, mortgage credit availability, as indexed by the Mortgage Bankers Association, slipped 0.9 percent in April and is back to its lowest level since January of 2013, with “significantly reduced origination volume” (i.e., sales), a tightening in broader credit conditions, and “expectations of a weakening economy” in the second half of this year.
And while the index for jumbo loan availability actually ticked up 1.5 percent last month, the spread between jumbo and conforming loans has narrowed and jumbo loan availability has dropped by around 25 percent over the past year and is 50 percent lower than prior to the pandemic, at the end of 2019.
I wonder if I was too conservative with my prediction of -35% adjustment ..
US is irretrievably on a path to servicing debt with more debt – what is the turnaround strategy?
The turnaround strategy is that we grow our way to the point where the debt level isn’t growing as quickly as GDP.
People were wringing their hands in the mid-nineteen nineties saying the same thing you are: we are (were) servicing debt with more debt. Then we had budget surpluses starting beginning with the 1997 budget.
Yes, but that growth increases inflation and other knock-on effects. Not quite the same as 90s, which may have been peak of US influence, internationally now it’s all polarization and dedollarization. And those budget surpluses in late 90s coincide with everything bubble 1.0.
Did you know that foreign govts hold 7T$ in US debt — not all of them friendly …
In other words, if it’s not US or global consumer — what is going to drive that growth?
80% of jobs at risk of AI sounds bearish if anything …
Reparations of hundreds of billions of dollars (maybe a couple of trillions) will drive RE inflation. This isn’t a joke.
Pretty sure the word you wanted to use here was repatriation not reparations. No need to trigger the Fox News-watching trolls here.
How is “mortgage credit availability” measured (I understand the plot is an index, not the actual measurement) and what does this plot look like if you extend it back another 5 years before the Great Recession?
You can read a pretty good summary of how the Mortgage Bankers Association prepares the Mortgage Credit Availability Index (MCAI) on their website and they say that you can even download the historical data, which presumably would enable you to plot what it looked like going back five years before the Great Recession, although I haven’t tried it.
This should further lower home prices because it reduces the “demand” (buying pool)?