While the net number of homes on the market in San Francisco ticked down 3 percent over the past week with typical seasonality in play, inventory levels are over 30 percent higher than at the same time last year, with over 40 percent more single-family homes on the market and pending home sales down nearly 50 percent to their lowest levels in over six years on a seasonally adjusted basis.
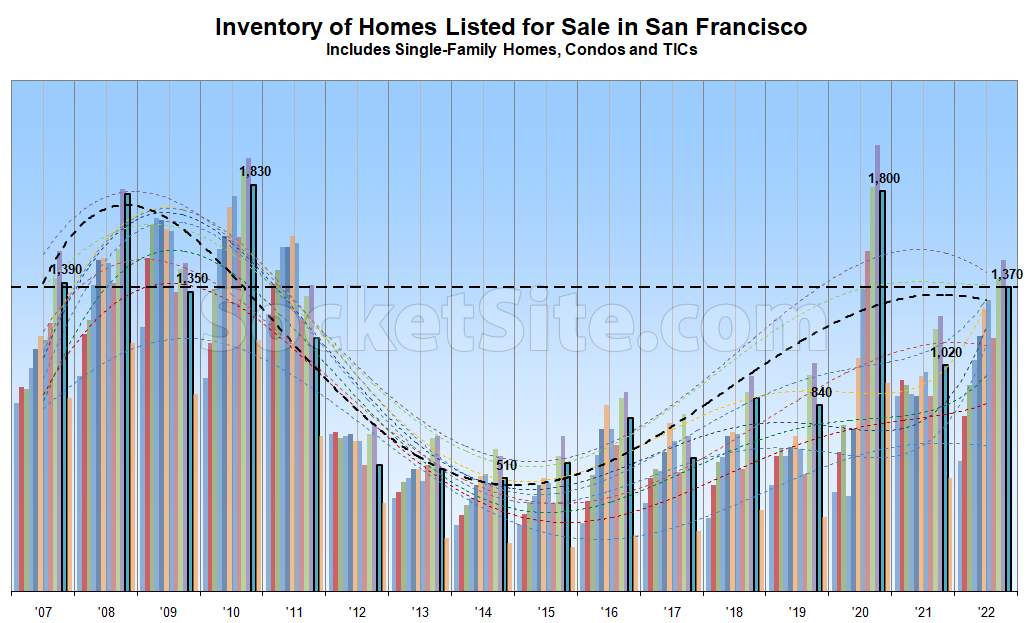
With the drop in sales, inventory levels are effectively at a 12-year high in San Francisco on a seasonally adjusted basis, save for when the market was frozen in 2020, with over 40 percent of the homes on the market in San Francisco having been reduced at least once, which is the highest percentage of reduced listings since the fourth quarter of 2011.
Expect inventory levels to tick down through the end of the year in the absolute, but up on a seasonally adjusted basis, accompanied by a further increase in reductions and properties being withdrawn from the MLS before returning in the spring. We’ll keep you posted and plugged-in.
How are prices responding, if at all? It seems from the limited data available to me as if the decline in demand is translating to longer sales, more inventory, but not materially lower selling prices.
It’s still early in the cycle, but as we outlined last week, the average list price per square foot of the homes which are in contract has dropped under $940 per square foot, which is 6 percent lower than at the same time last year and down 7 percent since May.
Given the chaos of the past 2 years, comparing YOY directly may be misleading. The chart makes it obvious how inventory spiked in 2020 and then disappeared in 2021 as everyone bought all of the houses everywhere with cheap money.
I think news of the demise of the SF market is perhaps overstated. I follow the Outer Richmond more than other neighborhoods and have seen several single family homes sell for over $1k psf in October/November (higher mortgage rates). There is still a lot of money floating around, depending on the product.
Condos have certainly not performed as well.
If the average psf is $940, then seeing some data points over $1k isn’t really that unexpected. Especially in the more suburban parts of the city.
Sure, but the Outer Richmond is pretty middle-of-the-road as far as neighborhoods go. It hasn’t been where the highest ppsf sales have been at any point.
Nobody should be conflating cheaper and cheap. Regardless, the inventory spike in 2020 was an artifact of the market being frozen and the subsequent drop, to levels that were still higher than prior to the pandemic, was driven by the market opening back up and the ability to actually close/move, not a rate-driven spike in demand.
Plenty of people bought and sold real estate in 2020. There was a sea change in perspective (swinging toward optimism) once the new Work-From-Home normal took hold in 2021, which was abetted by low rates.
Demand (by Sales Volume definition!) for housing was not constant between 2020 and 2021.
Not quite. Turnover was pushed from 2020 into 2021. And while some mistook the resultant jump in sales from 2020 to 2021 as a “sea change,” it wasn’t.
That incorrect opinion is not at all backed up by the unlike content found at the hyperlink.
You’re right, it is our opinion that a temporal blip, which was in response to the market having been frozen, and has since reversed course, as linked, isn’t representative of a “sea change” event, as we outlined at the time.
Your reductions are not apt, and again, linking to your own opinions to back up your own opinions is never closure.
You might not like it, but “the number of homes in contract to be sold across San Francisco is now 46 percent lower than at the same time last year and pending home sales activity is at its lowest level in over six years on a seasonally adjusted basis, with the average list price per square foot of the homes which are in contract having dropped under $940 per square foot, which is 6 percent lower than at the same time last year and down 7 percent since May,” which is not an opinion but fact, as linked, and which brings us back to the actual data at hand.
Like it or not like it isn’t the point here. Year over year isn’t the point when it’s coming out of a 100 year black swan event + all time low rates either. Nor is a current environment with strident Fed rate hikes a normal thing either.
It’s not simply year-over-year, “pending home sales activity is at its lowest level in over six years on a seasonally adjusted basis” and trending down, while inventory, which has been trending up for years (see above) is effectively at a 12-year high.
Which brings us back to our point that last year’s jump in sales wasn’t indicative of a sudden “sea change” event, despite some misinterpretations to the contrary.
Yeah. Not what I’m saying wrt 6 years either. The post pandemic market was an anomaly out of the last 8 years. So too is the Fed interest rate stances. You keep wanting to slap these markers on these things and it’s not very good.
Unfortunately, 3 percent mortgage debt was the actual anomaly and the Fed’s actions, which shouldn’t have caught any plugged-in readers by surprise, have returned rates to a range that’s within their historic averages. At the same time, the inventory trend predates the pandemic as well, but don’t let that stop you from pounding the table.
The outer neighborhoods are doing phenomenally well. They are routinely at the top of the list of neighborhoods regarding average days on market and % of listings selling within 30 days.
I am fairly certain that:
-All San Francisco real estate is down some amount since the lowest rates of last year.
-Single Family Homes are doing better (median PPSF citywide ticked up for single family homes from Sep to October). My friends who bought homes in the past year still faced multiple competing offer situations.
-Condos and smaller units are doing worse (median PPSF citywide continued down Sep-October)
-Small multifamily buildings continue to trend lower. I haven’t run a chart to look at the spread in PPSF between Multifamily buildings and Single Family structures in the same neighborhood, but I would wager we are reaching the wider or widest end or the range in recent memory,
-Compared with other asset classes, residential real estate in San Francisco is doing remarkably well in the face of:
An exodus of workers from urban centers
Much higher interest rates for borrowers
Big tech layoffs
Increasing street issues/social ills in the city.