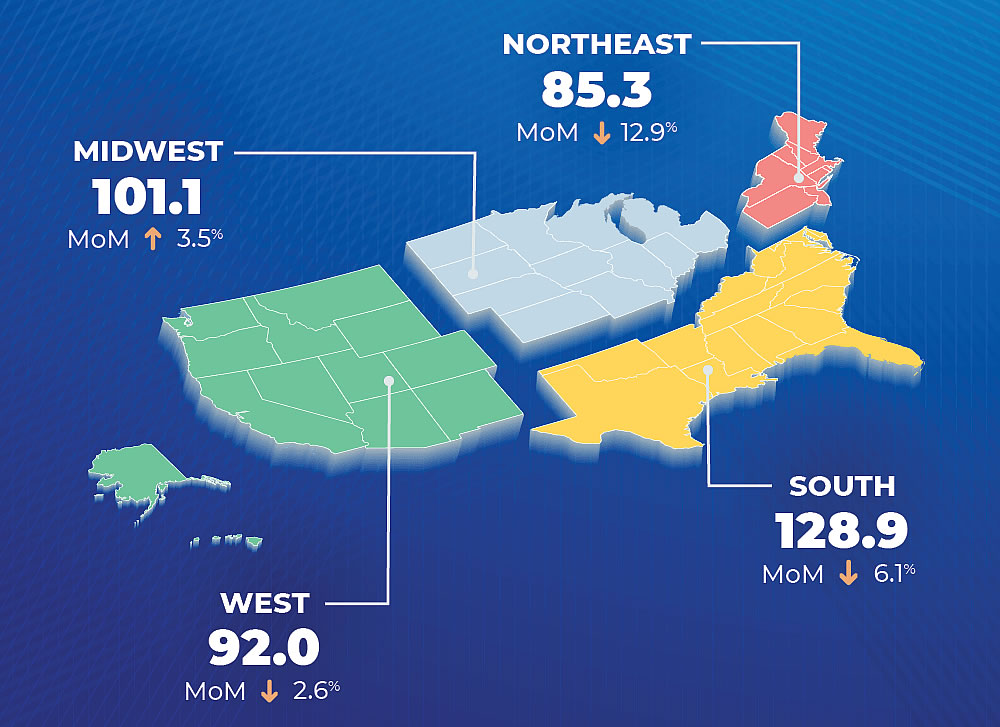
As we noted last month, with mortgage application volumes across the nation having declined, the National Association of Realtors Pending Home Sales Index was poised to drop despite having ticked up in March. And in fact, the Pending Home Sales Index, a seasonally adjusted index for which 100 denotes “an average level” of activity, dropped 4.4 percent in April to 106.2 with a 2.6 percent drop out west to 92.0.
And while 51.7 percent higher than at the same time last year, at which point the index hit a pandemic-driven, all-time low, the Pending Home Sale index is down 20 percent from August while inventory levels for both existing and new homes have been on the rise, as has been the case locally.
This trailing indicator is not congruent with San Francisco’s April and May sales volumes. They were at record high levels ’21 over [insert nearly any year here] and much higher than August ’20, or September ’20 for that matter, considering it is trailing.
As we outlined earlier this week and linked above, “having peaked in early April when 19 percent higher than today, pending home sales [in San Francisco] ticked down 4 percent over the past week…with an average list price per square foot of around $990 versus $1,030 at the same time last year” and “the number of single-family homes on the market (270) up 1 percent on a year-over-year basis and the number of condos on the market (670) up 11 percent.”
Well a 990/ft list price this year versus a 1030/ft list price during lockdown plus the number of homes only being up 1 percent is also indicative of a very heated marketplace. Also, do you intend to go back and illustrate the closed dollars per feet figures year over year? This year has been marked by overbidding so a pending asking price metric needs following up.
And despite all the overbidding and heat, the average sale price per square foot in San Francisco actually ticked down to around $1,000 over the past year, versus over $1,050 per square foot the year before, which shouldn’t catch any plugged-in readers by surprise.
Well that of course begs the questions as to what you”re using for a “year,” one. Secondly it brings to mind the disproportionate effects condo buildings were exposed to during the pandemic.
A year is 12 months. And with condos making up the majority of the market in San Francisco, that would be the dog wagging its tail, not the other way around.
Of course a year is 12 months. So the 12 months you reference include the initial lockdown portion of the pandemic in addition to the the specific challenges condo buildings faced in the pandemic. As to tail and dog and who’s wagging what, if you wish to describe to your readers why condos did not face unprecedented challenges during the pandemic, by all means do so.
To wit, per the MLS, SFRs condos and TICs: 1/1/20 – 5/29/20 1355 sales, $1066.71/ft. But 1/1/21 – 5/29/21 2627 sales $1073.01 /ft.
A Real Estate year has 10 months. But it goes 20% over asking. 😉