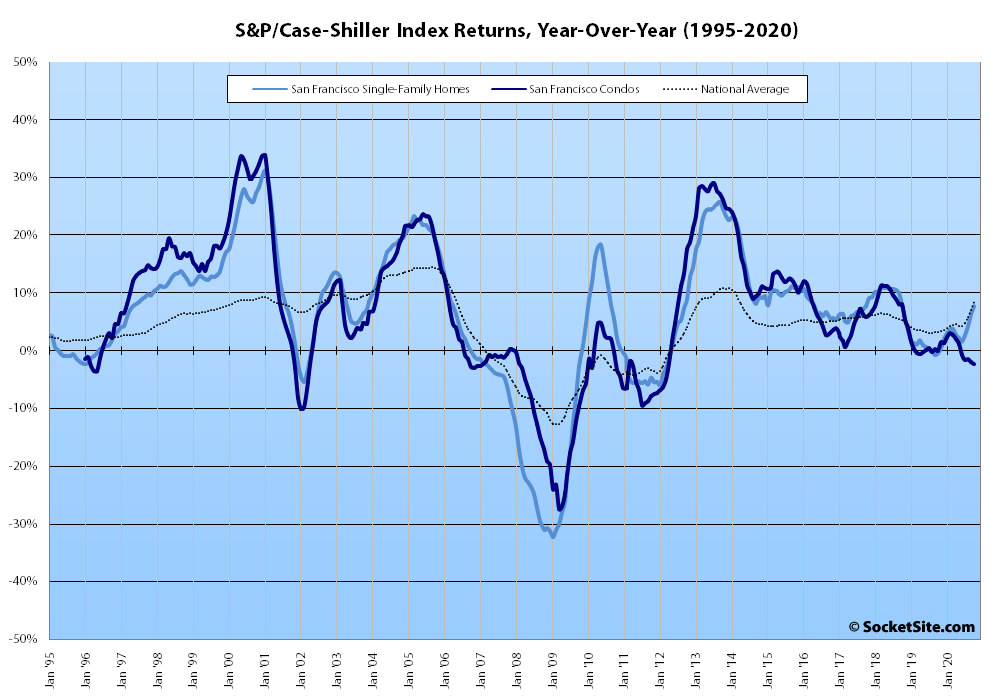
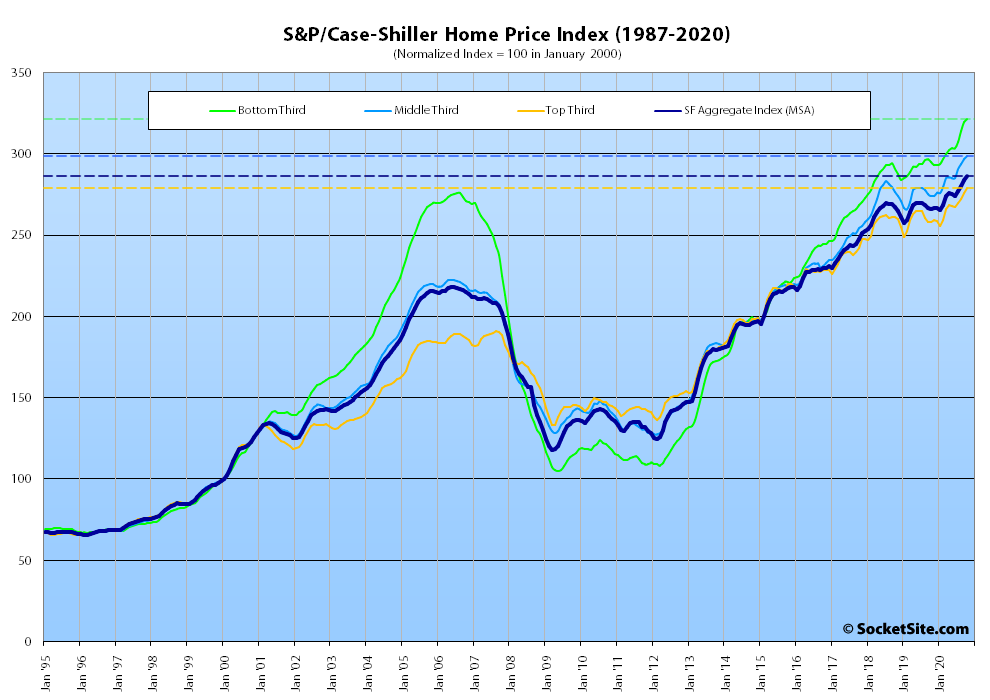
Having ticked up an upwardly revised 1.3 percent in September, the S&P CoreLogic Case-Shiller Index for single-family home values within the San Francisco Metropolitan Area – which includes the East Bay, North Bay and Peninsula – inched up another 0.9 percent in October for a year-over-gain of 7.7 percent versus 8.4 percent nationally.
At a more granular level, the index for the least expensive third of the market inched up 0.6 percent in October for a year-over-year gain of 9.1 percent; the index for the middle third of the market inched up 0.8 percent for a year-over-year gain of 9.0 percent; and the index for the top third of the market ticked up 1.2 percent in October and is now 8.2 percent above its mark at the same time last year.
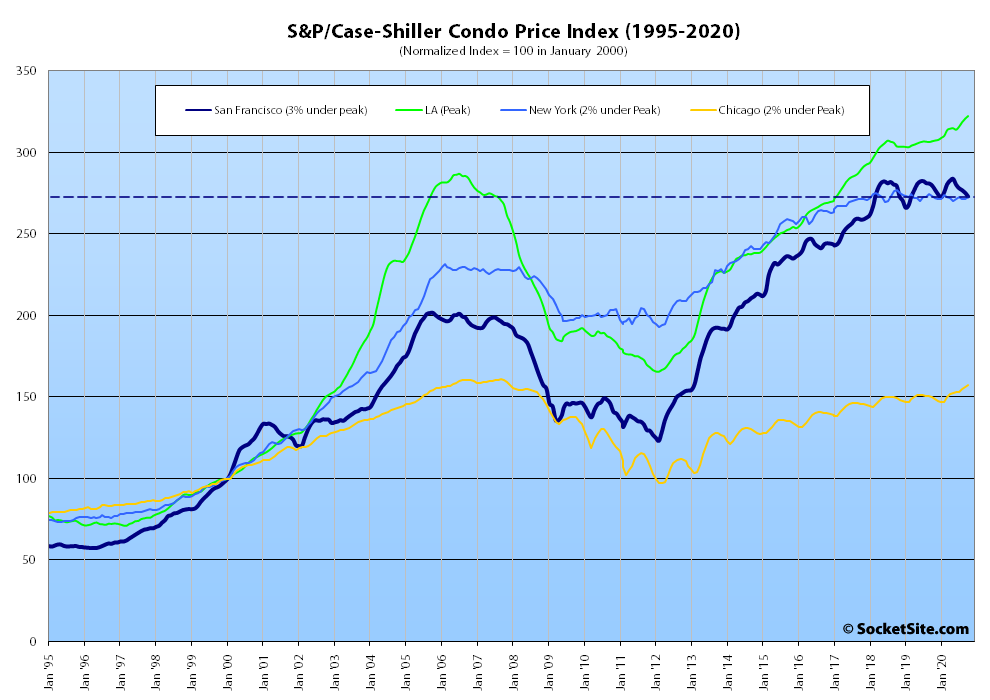
At the same time, the index for Bay Area condo values, which remains a leading indicator for the market at a whole, inched down another 0.8 percent in October and is down 2.3 percent on a year-over-year basis, versus year-over-year gains in Los Angeles, Chicago and Boston and a 0.1 percent decline in New York.
And nationally, Phoenix still leads the way in terms of indexed home price gains (up 12.7 percent on a year-over-year basis), followed by Seattle (up 11.7 percent) and San Diego (up 11.6 percent) and New York registering the lowest year-over-year gain on an indexed basis at 6.0 percent.
Our standard SocketSite S&P/Case-Shiller footnote: The S&P/Case-Shiller home price indices include San Francisco, San Mateo, Marin, Contra Costa and Alameda in the “San Francisco” index (i.e., greater MSA) and are imperfect in factoring out changes in property values due to improvements versus appreciation (although they try their best).


It would be great to see an overlay of number of units completed vs the indexed price. I’d wager that the reason condos have been choppy since summer 2018 is a large increase in units coming online, whereas SFH’s have had far less new inventory.
Except an even greater number of units were delivered in 2014, 2015, 2016 and 2017.
Quite simply, condo values are more volatile and tend to be a leading indicator for the market as a whole as they’re more likely to serve and be traded as investment vehicles than single-family homes.
It’s astonishing to see the price gains in the midst of a deadened economy. I’m seeing it everywhere I go, crazy gains in Martha’s Vineyard – I think Obama is a bigger factor than people realize, Oregon, even freakin’ Hawaii which has killed its economy and should not be seeing strong prices.
What do you mean by “Obama Factor”?
And makes sense, if holding and buying of real estate, is done to preserve wealth and as a hedge against inflation. Given bonds have a minuscule return adjusted for inflation. And it is becoming much more complicated to eek out alpha in fixed income.
The question is whether the flight to real estate is substantiated by data. SocketSite, any insights here?
“What do you mean by “Obama Factor”?
I assume the reference was to the fact that the Obamas purchased a home on Martha’s Vineyard.