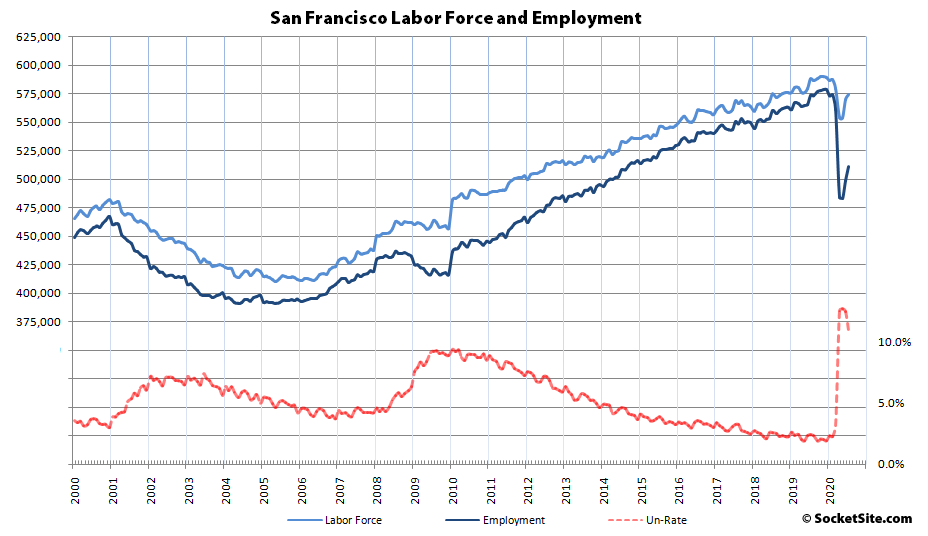
While the number of San Francisco residents with a job increased by 12,400 last month, there are still 66,900 fewer employed people in the city (511,200) than there were prior to the pandemic (578,100) and 62,400 fewer than at the same time last year (573,600) with an unemployment rate of 10.9 percent.
As a point of reference, the unemployment rate in San Francisco maxed out at around 9.4 percent at the height of the Great Recession. That being said, and despite the higher unemployment rate, there are still 74,500 more employed people in San Francisco today than there were a decade ago.
Over in Alameda County, which includes the City of Oakland, the number of employed residents increased by 9,500 in July for a total of 722,500 employed, but there are still 98,700 fewer employed people in the County than at the same time last year with an unemployment rate of 13.4 percent.

Across the greater East Bay, including Solano County, net employment increased by 18,100 to 1,380,700, which is still 187,400 fewer employed residents than at the same time last year with a blended unemployment rate of 12.0 percent.
Up in Marin, total employment increased by 5,000 in July to 122,000, but is still down by 15,800 versus the same time last year, with an unemployment rate of 8.8 percent. Employment in Napa ticked up by 1,100 to 65,100 but is still down by 8,600 on a year-over-year basis with an unemployment rate of 10.5 percent. And the number of employed residents in Sonoma County increased by 5,400 last month for a total of 228,300 employed, which is still down by 24,900 on a year-over-year basis with an unemployment rate of 9.8 percent.
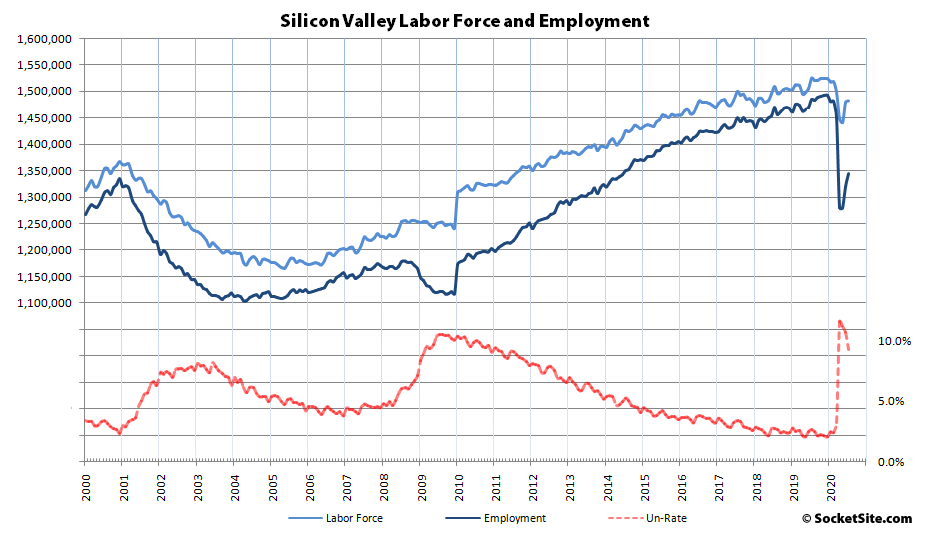
Down in the valley, employment in San Mateo County increased by 9,900 for a total of 403,800 employed but remains down by 49,300 on a year-over-year basis with an unemployment rate of 9.3 percent. And while the number of employed residents in Santa Clara County increased by 13,400 last month, for a total of 940,100 employed, there are still 91,700 fewer employed residents than here were at the same time last year with an unemployment rate of 9.3 percent.
And as such, while net employment increased by 62,800 across the Bay Area last month, versus a gain of over 110,000 in June, total employment (3,651,200) is still down by 420,200 since the pandemic hit, and down by 440,100 on a year-over-year basis, with an unemployment rate of 10.6 percent.
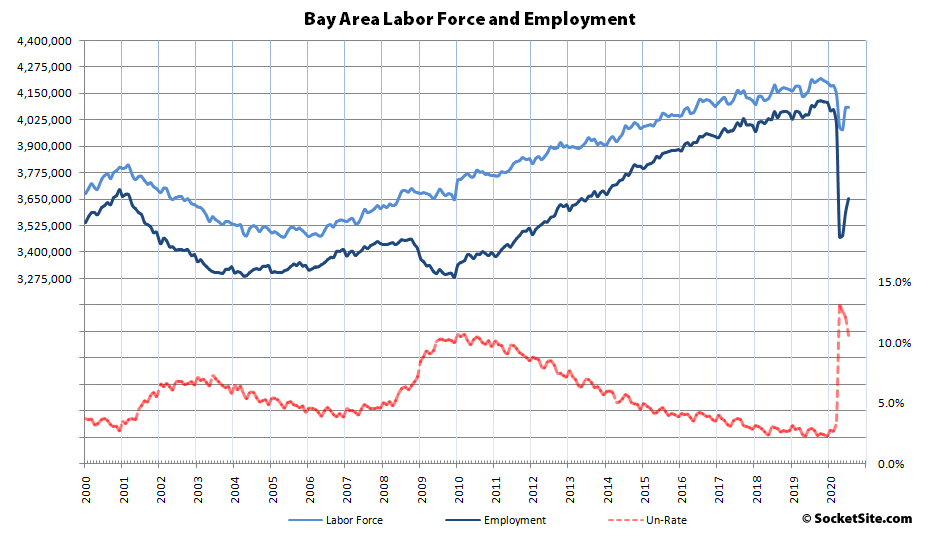
Also of note, the Bay Area labor force, which is still down by over 100,000 since the pandemic hit, barely budged (+2,000) in July and actually slipped (-3,500) in Alameda.
For SV the text doesn’t seem to match the graph: each line seems to be 2.5%, so the rate (9.3%) should be slightly BELOW the fourth line, but the graph seem to show it slightly ABOVE that mark; or does “Silicon Valley” include more than SM and SC counties ?? Or maybe the lines aren’t (exactly) 2.5% (?)…the percentage markers seem to be increasingly offset the further up the graph one goes.
Do you want to know what is truly scary? Picture that none of the pandemic happened. Now remove that dip. Bring it right up to the beginning of the “V”.
Now drop rates to zero from that point in time and signaled to be there for at least 2 more years as inflation picks up to ~4% annual, and also factor in all of the TSLA/FB/AAPL RSUs hitting double or triple, splitting…