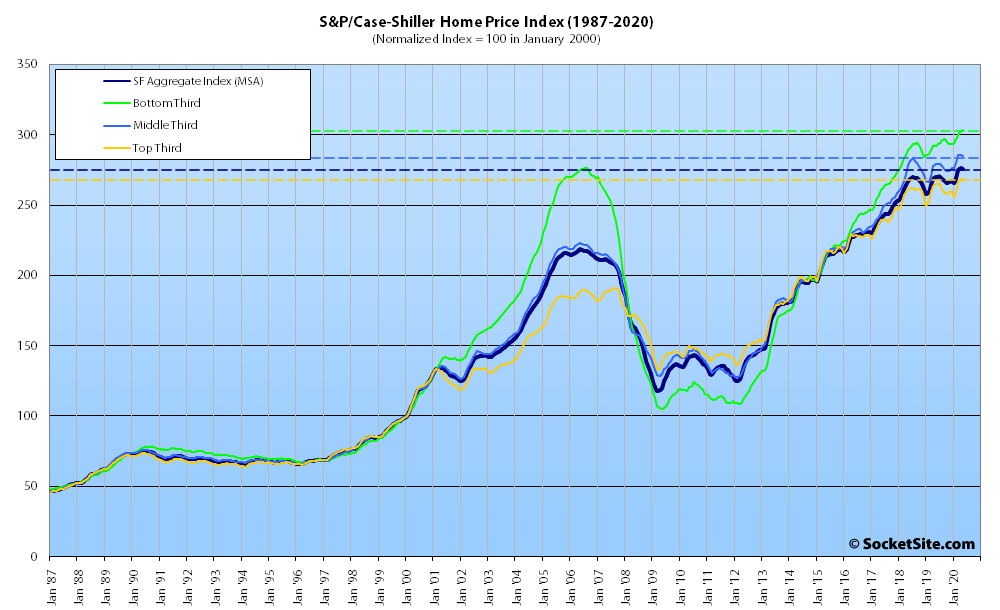
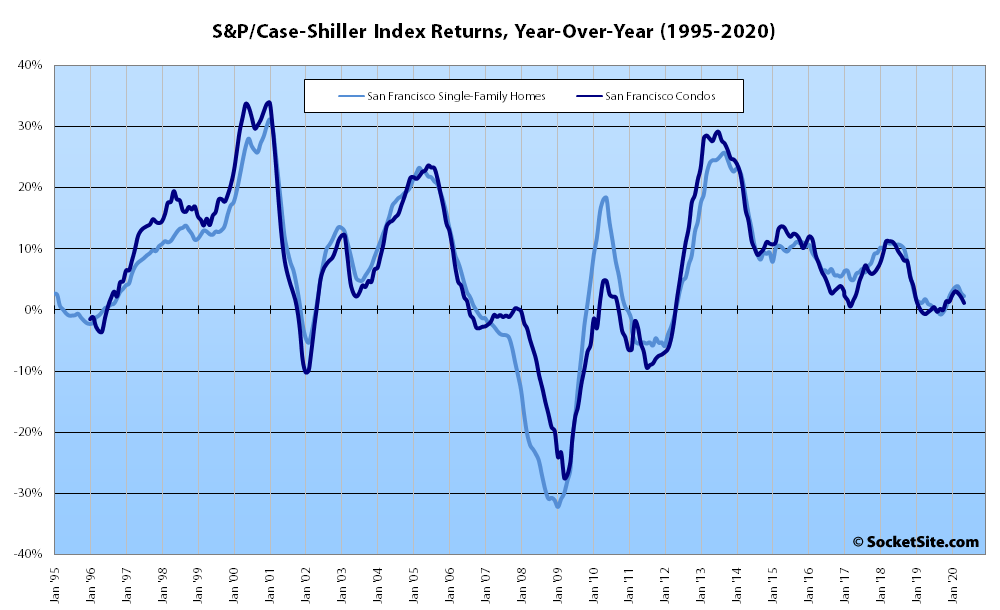
Having inched up to an all-time high in April, the S&P CoreLogic Case-Shiller Index for single-family home values within the San Francisco Metropolitan Area – which includes the East Bay, North Bay and Peninsula – slipped 0.2 percent in May and the year-over-year gain for the index inched down to 2.2 percent.
At a more granular level, while the index for the least expensive third of the market inched up 0.4 percent in April and is still up 3.8 percent on a year-over-year basis, the index for the middle third of the market slipped 0.4 percent and its year-over-year gain dropped to 2.0 percent, and the index for the top third of the market slipped 0.1 percent and its year-over-year gain is down to 1.4 percent.
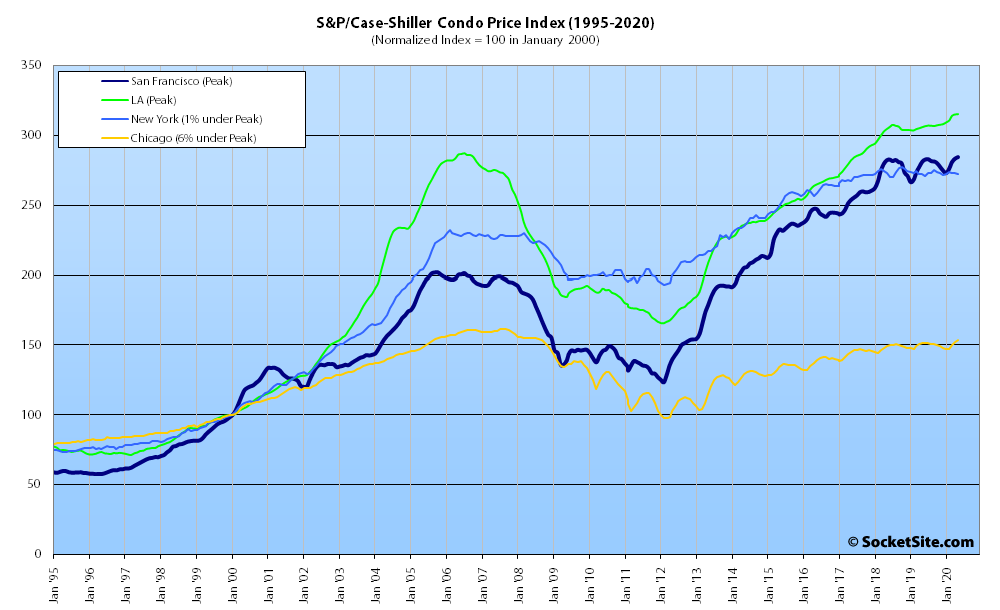
At the same time, the index for Bay Area condo values managed to inch up 0.4 percent and is now running 1.1 percent higher than at the same time last year.
Nationally, Phoenix still leads the way in terms of indexed home price gains (up 9.0 percent on a year-over-year basis), followed by Seattle (up 6.8 percent) and now Tampa (up 6.0 percent), with a national average increase of 4.5 percent and only Chicago (up 1.3 percent) and New York (up 2.1 percent) lagging San Francisco’s 2.2 percent gain.
And on a month-over-month basis, San Francisco was the only indexed market to record a decline.
Our standard SocketSite S&P/Case-Shiller footnote: The S&P/Case-Shiller home price indices include San Francisco, San Mateo, Marin, Contra Costa and Alameda in the “San Francisco” index (i.e., greater MSA) and are imperfect in factoring out changes in property values due to improvements versus


Another record high for condo prices. For single family homes, within 0.2% of last month’s record and 2.2% above last year’s prices. Again, no surprise to those looking at the market objectively rather than focusing on the most extreme outlier anecdotes. Maybe the pandemic, rough economy, and rising inventory levels will result in lower prices at some point, but clearly not yet (at least as of May), despite all the chatter. Other markets show even stronger results than SF’s remarkably strong showing. Not what I predicted for SF or more broadly when this all hit.
And once again, the Bay Area, in general, has certainly outperformed San Francisco specifically since 2015, as has the least expensive third of the market across the board.
But the index for condo values and the middle of the market, into which the majority of San Francisco properties would fall, effectively peaked back in mid-2018, with total net changes of 0.4 – 0.6 percent since.
And of course, when the index slips we’re well past the point of the leading indicators, the “anomalous few,” the rationalized “outlier anecdotes,” or even simply “some” segments of the market having dropped – it’s then representative of the majority being in decline.
You say that “when the index slips” we’re past these various things, but the index hasn’t slipped. It’s at record high levels.
And you keep repeating that “the Bay Area, in general, has certainly outperformed San Francisco specifically since 2015,” but you’ve never provided any evidence. Are you willing to show everyone the specific data on which you base that broad conclusion, for which I’ve never seen any support? There may be something to it, but just saying it doesn’t make it so.
And so it begins…