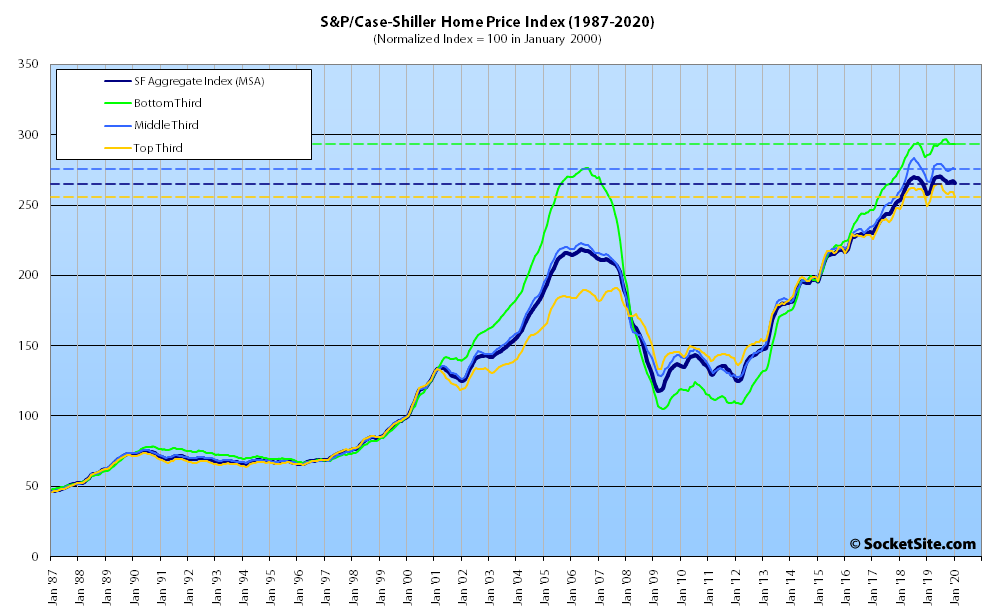
Having ended last year up 2.1 percent on a year-over-year basis but 1.3 percent below peak, the S&P CoreLogic Case-Shiller Index for single-family home values within the San Francisco Metropolitan Area – which includes the East Bay, North Bay and Peninsula – slipped another 0.5 percent in January, which likely feels like ancient history, and started the year 1.7 percent below peak (which shouldn’t catch any plugged-in readers by surprise).
At a more granular level, while the index for the bottom, least expensive, third of the market started the year 2.9 percent above its mark in January of 2019, it’s now 1.3 percent below its peak in the third quarter of last year; the index for the middle third of the market slipped 0.4 percent in January and is now 2.9 percent below its mid-2018 peak; and having dropped 1.3 percent in January, the index for the top third of the market is now 3.5 percent below its mid-2019 peak.
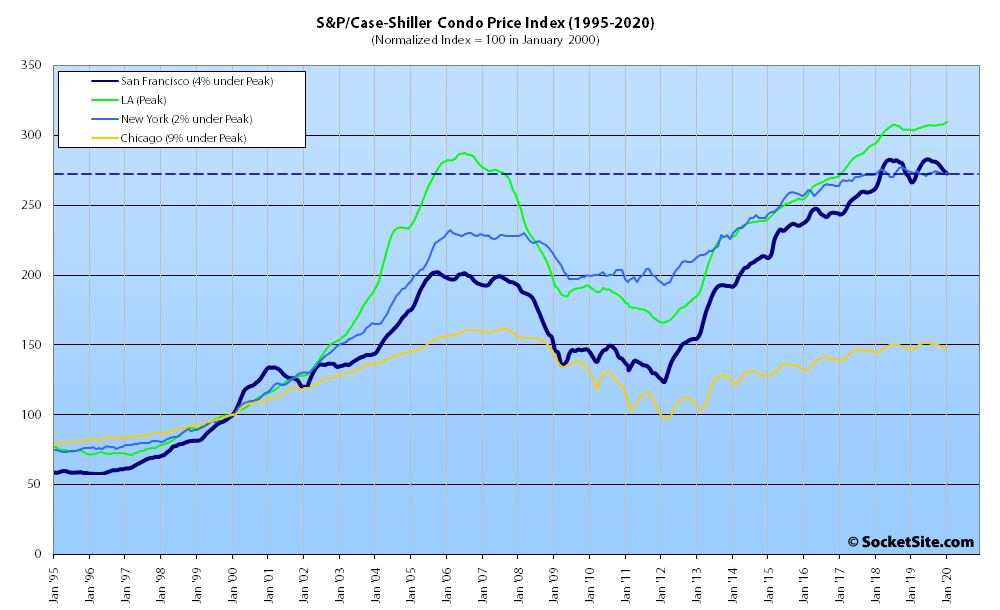
At the same time, the index for Bay Area condo values slipped 0.7 percent in January and is now down 3.6 percent since peaking in July of last year.
Nationally, Phoenix was still leading the way in terms of home price gains in January, up 6.9 percent on a year-over-year basis, followed by Tampa and Seattle (which were both up 5.1 percent, year-over-year).
But in the words of the Global Head of Index Investment Strategy at S&P Dow Jones Indices: “It is important to bear in mind that today’s report covers real estate transactions closed during the month of January. The COVID-19 pandemic did not begin to take hold in the U.S. until late February, and thus whatever impact it will have on housing prices is not reflected in today’s data.”
Our standard SocketSite S&P/Case-Shiller footnote: The S&P/Case-Shiller home price indices include San Francisco, San Mateo, Marin, Contra Costa and Alameda in the “San Francisco” index (i.e., greater MSA) and are imperfect in factoring out changes in property values due to improvements versus appreciation (although they try their best).


