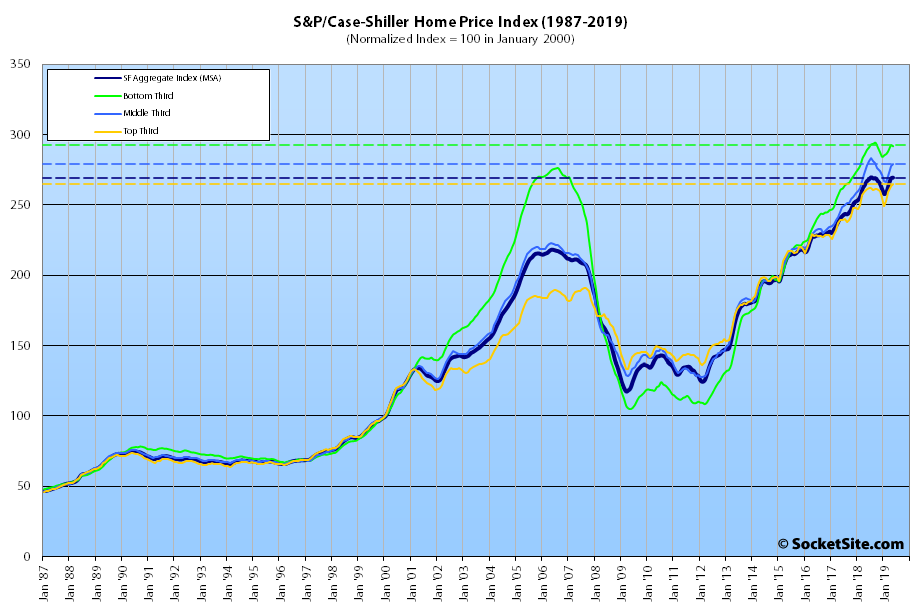
Having ticked up 1.6 percent in April, the S&P CoreLogic Case-Shiller Index for single-family home values within the San Francisco Metropolitan Area – which includes the East Bay, North Bay and Peninsula – inched up 0.3 percent in May.
And with the index now hovering just below its peak in the third quarter of 2018, at which point it was up 10.7 percent on a year-over-year basis, it’s now running 1.0 percent above its mark at the same time last year, which is the smallest year-over-year gain for the index since the second quarter of 2012 and down from a 10.8 percent year-over-year gain at the same time last year.
At a more granular level, the index for the bottom third of the market slipped 0.2 percent in May for a year-over-year gain of 1.0 percent (versus a year-over-year gain of 10.8 percent at the same time last year); the index for the middle third of the market inched up 0.5 percent for a year-over-year gain of 0.1 percent (versus a year-over-year gain of 13.8 percent at the same time last year); and the index for the top third of the market inched up 0.5 percent for a year-over-year gain of 1.3 percent (versus a year-over-year gain of 9.4 percent gain at the same time last year).
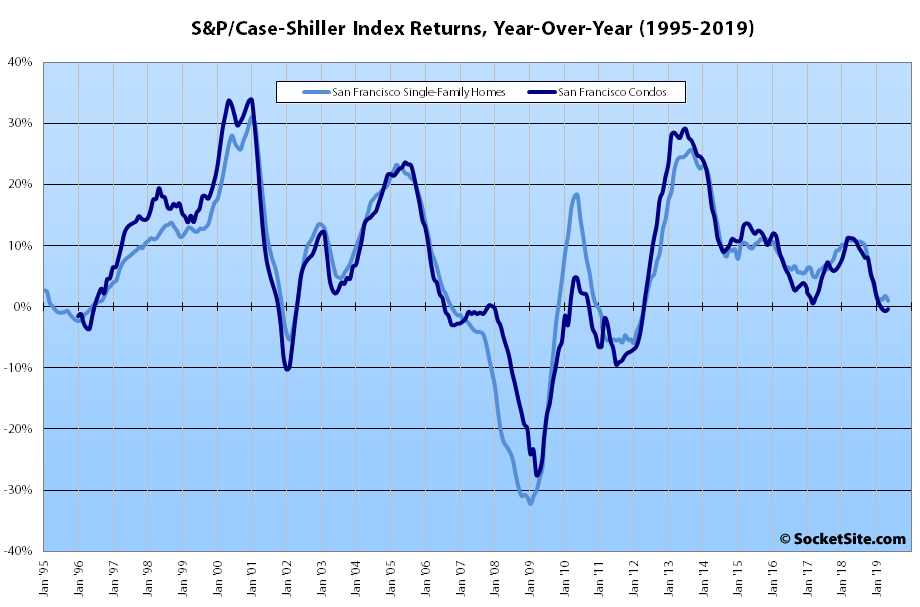
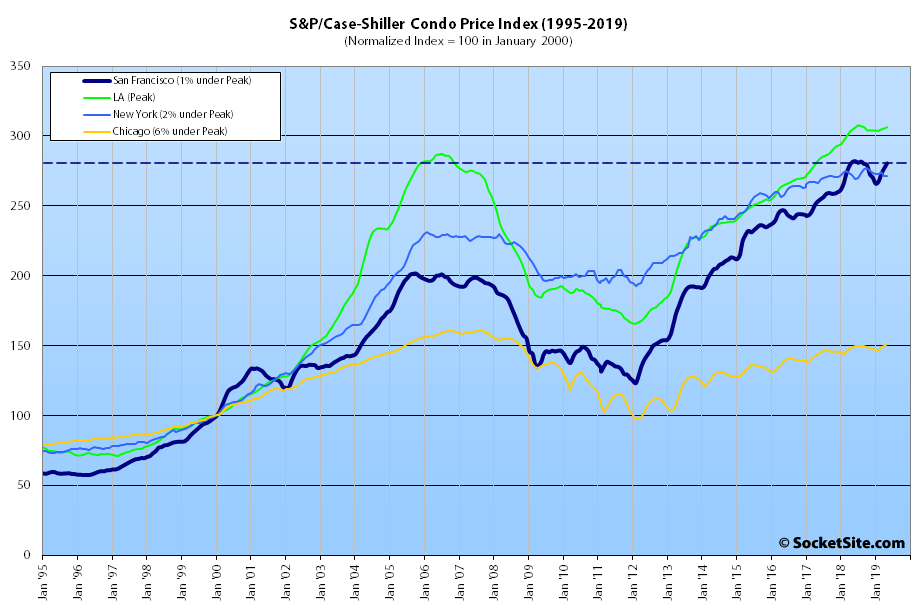
And while the index for Bay Area condo values ticked up 1.3 percent in May, it’s down 0.4 percent on a year-over-year basis and 0.5 percent below its peak in the second quarter of last year.
As we first noted last year, Las Vegas is still leading the nation in terms of home price gains, up 6.4 percent on a year-over-year basis, versus a national average of 3.4 percent, followed by Phoenix (up 5.7 percent) and Tampa (up 5.1 percent).
And at 1.0 percent, San Francisco ranked next to last in terms of year-over-year gains for the top 20 metropolitan areas in nation, above only Seattle (the index for which actually gained 1.0 percent in May but was down 1.2 percent on a year-over-year basis).
Our standard SocketSite S&P/Case-Shiller footnote: The S&P/Case-Shiller home price indices include San Francisco, San Mateo, Marin, Contra Costa and Alameda in the “San Francisco” index (i.e., greater MSA) and are imperfect in factoring out changes in property values due to improvements versus appreciation (although they try their best).
The methodology page for the Case Shiller index on the Core Logic web site is interesting:
“Different weights are assigned to different changes in home prices, based on their statistical distribution in that geographic region. The weighting schemes include:
Price Anomalies:
Smaller weights are assigned to homes that appear to have changed in quality or to sales that are not otherwise representative of market price trends.
High Turnover Frequency:
Homes that sell more than once within six months are excluded from the calculation of any index.
Time Interval Adjustments:
Longer sales pair intervals are assigned less weight than pairs with shorter intervals.
Initial Home Value
Each pair is assigned a weight equal to the first sale price.”
In other words, and per our standard footnote above, “the S&P/Case-Shiller home price indices…are imperfect in factoring out changes in property values due to improvements versus appreciation (although they try their best).”
This must bias the index upward. Improvements increase the value of a home above market appreciation. So any errors in filtering out appreciation make the index seem better than the actual performance of the market.
This should not come as a surprise. Some have noted since the height of the boom that trends were working against Bay Area real estate with a large slowdown in appreciation on the horizon. A period coming when Bay Area appreciation would track that of the nation – give or take.
The macro trends continue to work against residential real estate in the Bay Area. Population growth is minimal (and could go negative this year) at .4%. Less than California’s population increase which is .47% and barely half that of the nation as a whole. Dynamic metros like Phoenix, Seattle and the Texas cities are growing at 2, 3 or 4 times the rate of the Bay Area. Job growth is slow as companies aren’t relocating to the Bay Area and some local companies are shifting workforce to less expensive areas.
The mistake the Bay Area made as a region was its refusal to develop an aggressive plan to address housing needs. Building offices but not housing. Think the Central SOMA plan, think Brisbane’s “Badlands”. Forcing workers further and further out and worsening commutes. The repercussions of years of complacency by Bay Area government and business leaders is now being felt. Seattle/King County has aggressively addressed its housing needs for a decade now. Thousands and thousands of new units every year. The result? Seattle’s home appreciation has slowed significantly. Despite massive population growth and the addition of many new jobs. That is what regions hoping to remain robust business centers in coming decades need to do.
There is no point in building more housing when the infrastructure cannot handle it. The idea that people will ditch their cars is a pipedream unless they are within five minutes walk of a BART station. Statistics say: “Since the peak of the dot-com boom in 2000, per-commuter congested delay increased by about 65 percent while population and jobs grew by 15 percent and 12 percent, respectively.” That only includes freeways and not surface streets, I would argue those are even worse in some areas. That exponential rise will only continue if you increase the population without addressing transit.
I would agree with the above comment by Sabbie completely except that I would modify the second sentence to read “…unless they are within five minutes walk of a BART station or a light rail stop.” At the coffee shop I frequent, I find it astounding that most of the employees catch Uber and Lyft both to work and back. You’d think these folks would be the target market for public transit.
especially true for west side. im all for building up on west side, on geary corridor especially, but the public transit sucks (takes too long, often full). A geary subway is desperately needed, but hard to support a significant amount of housing without requisite public transit.
Interesting phrasing. “Nearing negative territory” means, of course, “prices still rising “. Looks like a new all time high for the upper tier. Pretty remarkable. We’ve been hearing “the downturn is upon us” here for three years. Yet prices keep going up. Won’t continue forever.
It certainly helps to look at volumes as well and to understand the difference between leading indicators of a slowdown, or downturn, and the majority of the market being in a full-on decline.
It also helps to understand the nuances of the various indexes and reports. For example, did you know that the majority of San Francisco properties wouldn’t make the cutoff to be indexed as “upper tier” homes?
But if you’re hanging your hat on this one index, homes in San Francisco are actually more likely to fall within the “middle tier,” which peaked 12 months ago, 13 months ago for condos, despite record high employment, near record low rates and every offering/bonus that’s happened since.
Your linked inventory numbers are a “leading indicator of a slowdown” in what? Housing prices? Pork bellies? You need to say what you have in mind, unless you’re keeping things deliberately vague so you can always deny whatever someone might later point to.
On target for new highs, but boy could it get interesting fast…