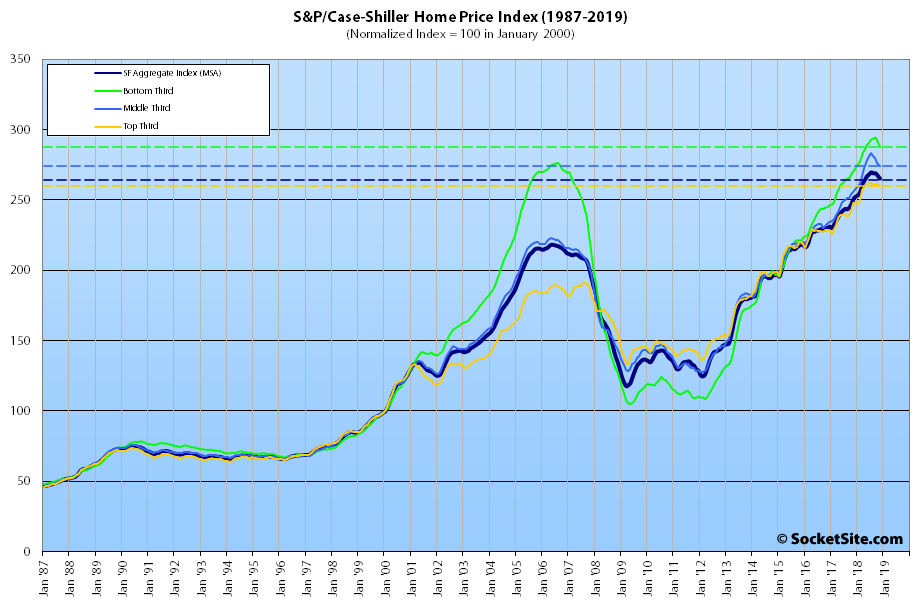
Having slipped another 0.7 percent in November, the S&P CoreLogic Case-Shiller Index for single-family home values within the San Francisco Metropolitan Area – which includes the East Bay, North Bay and Peninsula – has shed 1.4 percent over the past quarter and its year-over-year gain has dropped nearly five percentage points since August to 5.6 percent.
For the second month in a row, and only the second time since 2011, the index for the bottom third of the Bay Area market has dropped over a percent on a month-over-month basis, dropping 1.1 percent in November and pushing its year-over-year gain down from 8.3 to 6.2 percent.
And with the index for the middle third of the market having shed 0.8 percent in November, it is still running 7.2 percent higher on a year-over-year basis but has dropped 4.8 percentage points over the past quarter alone, while the index for the top third of the market only slipped 0.6 percent but its year-over-year gain has dropped to 4.9 percent, versus 9.7 percent just three months before..
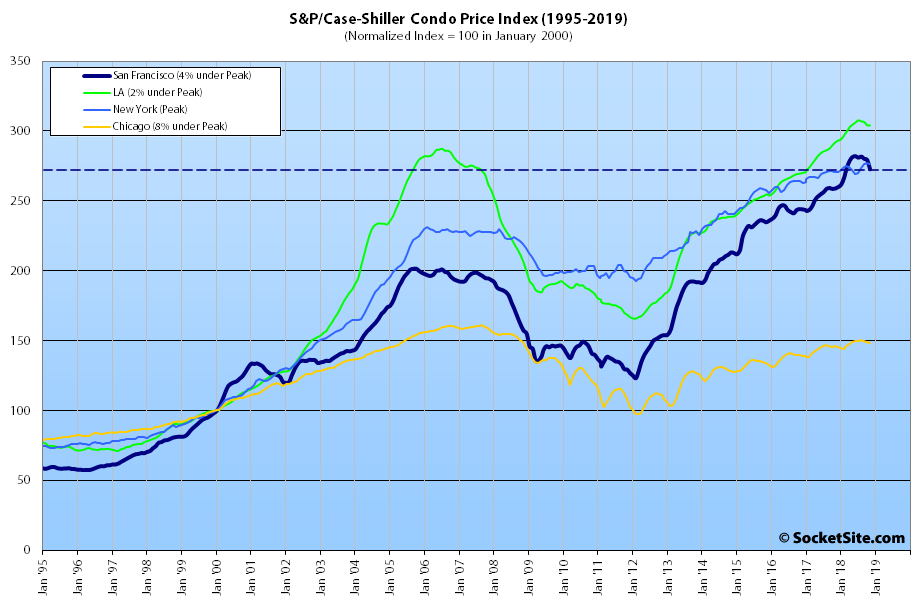
At the same time, the index for Bay Area condo values dropped 2.4 percent in November, which is the largest monthly drop since the fourth quarter of 2011, and is now running 4 percent under this past June’s peak but remains 5.3 percent above its mark at the same time last year and 35.2 percent above its previous cycle peak in the fourth quarter of 2005.
And while Las Vegas is still leading the nation in terms of home price gains, up 12.0 percent year-over-year versus a national average of 5.2 percent, Phoenix is now in second place (up 8.1 percent) with Seattle in third (up 6.3 percent). Once again, Las Vegas and Phoenix, two cities which featured rather prominently in the last major downturn, are now leading the way.
Our standard SocketSite S&P/Case-Shiller footnote: The S&P/Case-Shiller home price indices include San Francisco, San Mateo, Marin, Contra Costa and Alameda in the “San Francisco” index (i.e., greater MSA) and are imperfect in factoring out changes in property values due to improvements versus appreciation (although they try their best).
Interesting choice of a headline for this….that tiny little dip at the top of a massive mountain, hardly looks like a “hard hit”. More like a minor hiccup.
Once again, “the index for Bay Area condo values dropped 2.4 percent in November, which is the largest monthly drop since the fourth quarter of 2011,” and the largest November decline since a 2.7 percent drop in November of 2008 (when the stock market wasn’t still near an all-time high and interest rates were 25 percent higher than today).
But sure, ‘tis just another flesh wound, or minor hiccup, if you prefer.
A buyer in the fourth quarter of 2011 would have turned a tidy profit.
That’s true! Care to quantify the difference in returns between being a buyer in 2008 versus 2011?
2008 was a godsend for me, even though i had 3 properties that went down in value. I bought in 2009, 2011, 2012 and 2013. All 4 of those properties have mushroomed on value along with the 3 others I had before 2008. Equities and real estate go up and down in value. If you are too much of a coward to deal with the occasional downside, you will never make any REAL MONEY. I lost $250,000 in stocks yesterday and DON’T EVEN CARE.
So buying after values drop an average of 46 percent from their most recent highs, as was the case from 2009-2013, is a particularly good strategy? That’s good to know!
Keep in mind that housing markets tend to have momentum. When prices are rising strongly anyone who can even get a toehold on the market can do ok because appreciation will paper over many financial issues.
$1M isn’t too much to pay for a home or condo if you can soon sell it for $1.5. Nor is $1.5M too much to pay if you can soon sell it for $2M! And this greatly increases demand which feeds back into further rising prices. But how many people can afford to buy at $1.5M and have the value drop to $1.4M? Or worse $1M?? Far Far fewer. This cripples demand which then feeds back into further worsening prices.
Are you suggesting we’re facing 2008-type market conditions? On the verge of a global financial meltdown? Major financial firms going bankrupt? Money market funds breaking the buck?
At the end of the day all they’re doing is showing 33 years of history and providing a little bit of context. Interpretation is up to the reader. I would caution though that one peak-and-valley does not a pattern make. That said, every pattern has to start somewhere.
Imminent financial castatrophe: confirmed
The seasonal variation in condo prices is always the canary in the coal mine
Average November drop in the condo index since 2011? Up 0.2 percent. But sure, this year’s movement was simply “seasonal” (if one ignores the actual data and trends at hand).
So it’s 2011 all over again? – Well, that doesn’t sound so bad…
Keep in mind that in the 2008 cycle housing prices petered out of their own accord and it was the banking systems exposure to a housing price decline that nearly caused a global financial meltdown. Also the 2008 run up in housing prices was far broader than the current rise. Housing prices in a handful of coastal cities could decline significantly without necessarily causing a global financial crisis. Who knows what the exposure to a broader downturn would be?
Many are looking to rising corporate debt and exposure to a slowing Chinese economy as large potential risks to the global economy.
“In contrast, we are seeing elevated vulnerabilities in the nonfinancial business sector. Business borrowing has risen more rapidly than GDP for much of the current expansion and now sits near its historical peak . The run-up in corporate debt has brought the ratio of debt to assets close to its highest level in two decades on an overall basis, and this is also true for speculative-grade and unrated firms . And whereas previously, mostly high-earning firms with relatively low leverage were taking on additional debt, analysis of detailed balance sheet information indicates that, over the past year, firms with high leverage, high interest expense ratios, and low earnings and cash holdings have been increasing their debt loads the most. Historically, high leverage has been linked to elevated financial distress and retrenchment by businesses in economic downturns.”
What happened to the The Mark Company condo index? They seem to have discontinued it last summer.
I wonder if their clients asked them nicely to discontinue it with prices down y-o-y…
“quietly” 😉
SocketSite, I noticed that the home index starts in 1987 while the condo index starts in 1995. Assuming that the condo data isn’t available that far back, can the condo chart be narrowed so that it’s width matches the ’95+ width of the first graph? The way it’s displayed currently makes the condo graph look flatter than the home one.
One thing about Case-Shiller that many overlook is that it is very much a lagging indicator. Here we are almost in February and we’re getting the November CS data point. Additionally, the November CS data point is actually a 3-month trailing average of September, October & November. Additionally, the index disregards anomalous data points, ones with changes far from the previous trend, as a way to filter out remodeled homes. This is not unreasonable, but keep in mind that whenever the market goes through an inflection point the early data points will look anomalous relative to the previous trend. This adds further lag.
For months on here, people pointed to the then still rising CS index to “debunk” the ever growing apple cart of bad apples. And now CS is just confirming the beginnings of what we’ve already seen with apples transitioning from rising strongly, to flat, to 2017 pricing, then 2016 then 2015 and now looking at recent apples-to-apples a few of 2014 or 2013 vintage.
> whenever the market goes through an inflection point the early data points will look anomalous relative to the previous trend.
From a quick reading it looks like Case-Shiller downweights outliers when they don’t match their contemporary peers. Last month’s index doesn’t influence this month’s index, so I think you’re wrong on this point.
You’re right that most commenters have difficulty when discussing lagging indicators, but the real difficulty is that most people who comment here are just talking their book and will only look at indicators that match their story.
It’s not an issue of this months index vs last months index, but rather an issue that not all cities, neighborhoods or buildings turn the corner at the exact same time. So when some early bad apples sprout up in an area whilst most other areas are still shooting up, those early bad apples appear to be price anomalies. And you are correct that technically they will not completely discard an anomalous data point, those data points will be downwieghted with a weight which can approach, but not equal, zero.
But technical points aside, the bottom line is that when you encounter a sharp market transition this adds lag to when this transition is reflected in the index.
This also hints at why looking at apples-to-apples should complement looking at the index. Apples are near real time, while the index has a large lag. But apples just give you handfuls of data which gives you a noisier picture vs a wider area average which smooths things out. But a down side of an index created using bulk data is that they need to use automated and statistical methods to deal with oddball, non arms length, non-market (renovations, legal status change,…) transaction. Whereas if you look at a single data point you can thoroughly examine this sale and the last by hand to see if there are any non-market changes. And for the apples presented on this site, this has generally already been done for you.
No, prices move at a speed such that incremental changes are not going to be downweighted. You are free to base the Tipster-Anon2 Index on your insights about sudden fruit spoilage, but your statements about Case Shiller so far have been nonsense.
Take this recent apple which went for 1% below 2013 price. Do you think it’s in line with its contemporary peers? Is all of SF at below 2013 pricing? All of the greater bay area?
And as far as CS goes you can check everything at the horse’s mouth here, and they even give general guidance that “[…]typically 85% to 90% of pairs are assigned a weight of one (no down-weighting), 5% to 8% are assigned a weight between one and one-half, and 5% to 8% are assigned a weight between one-half and zero.”
But all this is essentially just a small side point. Look at the size of the 2007 cycle and the size of the up slope of this current cycle. This is not a game of inches! Maybe we are in a very large amplitude housing cycle just as we were in the 2007 era or maybe by some huge coincidence organic economic growth has sustainably pushed housing prices to around the same level as the top of that cycle. I’m sure that in 2025, or likely much sooner, the answer will be manifestly obvious and will not hinge on parsing out the minutiae of housing price index construction.
The description you are quoting does not mean what you want it to mean.
I am willing to accept the two month delay in Case-Shiller to get estimates that aren’t bullshit. Calculated Risk links to Zillow’s estimates for next month which have been pretty close. Note that even the Zillow estimate is not predicting the future, because the purpose of an index is to quantify the recent past. You dislike Case Shiller because it isn’t predicting the collapse you so desperately want, that’s your problem and not theirs.
You miss the point entirely.
I certainly don’t dislike Case-Shiller in fact I’ve often pointed people towards CS and away from looking as median price. As Median price is often misinterpreted as a metric of appreciation.
But for months and months as bad apples kept falling, some people here questioned why CS was still going up. I pointed out then, as I am saying now, that CS has a large effective delay and that you can’t expect the entire bay area market to turn the corner at the exact same time. And you should not expect to see a largely delayed index turn down the very first time bad apples start falling.
Time passed, more bad apples appeared and lo and behold CS turned negative.
And as you point out, a delayed index is not predicting anything. Instead a worsening crop of apples tells you about current conditions which will likely be reflected by case shiller many months down the road.
What CS does give you is a good historical record. And it’s worth noticing that the last cycle didn’t go from straight up right to straight down. There was a good year or so at the top (And the top wasn’t tabletop flat). And it’s always good practice to start by assuming “It’s NOT different this time” So my working assuming is that we’re in a ripple at the top and not beginning the downslope yet. But that being said, if anything it seems that sellers have conceded on price faster this time, the apples have gotten worse faster than I expected, and buyer attitudes have shifted faster than last time. So I wouldn’t say “predicting”, but I am looking at the apple crop and other factors to see if it’s likely that the time at the top is shorter than last time.
Trying to predict something based on a single graph is called “technical analysis” and it is another form of nonsense. Sorry.
Mortgage rates popped in September. With home prices at an all time high and stagnating stock market, I suspect many buyers got pushed out of the market.
Mortgage rates have since coming back down. Will values bounce back?
I doubt it. The economy is under threat. A slow economy would keep lowering values.
Stocks are up, bond yields are down, mortgage rates are down, employment is up, incomes are up, leading economic indicators are up. Yep, time to sell!
What measurements are you using?
One year ago the S&P 500 was at 2681. Today it is at 2640.
One year ago a 30 year fixed was 4.15%. Today it is 4.45%.
Socketsite quietly suggests we’re on the precipice of a 2008/09ish market cycle.
What economic threats most concern you?
That’s neither accurate nor factually correct. More like 2006/2007, having transitioned from 2005 (which we pegged as 2015 this time around).
The pending problems are caused by DC policy choices (deficit spending, tariffs, limiting immigration, etc). Those are completely different than the causes of the Great Recession, so there’s no parallel.
Agree with you about the source of most concerns and will point-out that many could/will result in increased inflationary pressures. Been watching gold? Other inflation hedges include equities and…real estate.
SFRealist says that pending problems “are caused by DC policy choices”, and rattles off a list including “limiting immigration”. Is it true? From September of last year, U.S. foreign-born population swells to highest in over a century:
Emphasis mine. The talk from the current administration is mostly just hot air; it hasn’t restricted immigration in practice, so the economy is under no real threat, even if you believe that economic growth depends on unrestricted immigration.
“the economy is under no real threat”
The stock market and the real estate market beg to differ.
(Not going to rebut the immigration claim in detail as it would be waaaaay off topic. But if you think the economy is under no real threat, well, then good luck.)
And yet, inventory is up, sales are down, and values, on an apples-to-apples and indexed basis, are falling.
The Fed has announced an end to rate increases, and a reduction in quantitative tightening
The S&P 500 is back to 2700
Bond yields are are moving back down
Mortgage rates are moving back down
Gold is up…a lot
Leading Economic Indicators continue to rise
Employment is up
Wages are up
BTW, much of the above signals “inflation.”
Yes, markets experience volatility — always have and always will. The dotard in the White House doesn’t help. Economic cycles occur — always have and always will. But it’s a big, big mistake to bet on an impending crash. A slump, maybe. Smart money will use it as a buying opportunity.
I never said a crash. I think a slump is likely. I don’t think we’re anywhere near the real estate bottom here. A slump is a good time to buy, but we’re only at the start.
“Economic cycles occur — always have and always will.”
True, but some factors can increase the amplitudes of theses cycles, sometimes greatly. Low interest rates, either teaser rates from banks as in the 2007 cycle or generally low rates from the fed in this cycle. Globalization of finance which allows much more capital to pile into a hot market and subsequently flee elsewhere when a market turns. A marked change in buyer attitude from looking at home price, valuation and life cycle ownership to becoming much more focused on just “can I make the payments” and fearful of missing out on home price gains (“Buy now or you’ll be priced out forever”).
“But it’s a big, big mistake to bet on an impending crash.”
Ironically, when its unwise or impractical to bet against a market this actually increases the cyclical factors. If it’s feasible to go short in a market and that market gets slightly overvalued, then the shorts will chase that profit opportunity and drive the market back towards equilibrium. Markets with longs and shorts balanced tend more towards classical efficiency and random walk behavior.
But if you think homes in SF are 10% overvalued, what are you going to do about it? Or 20%? Or 100%? Your only real choices are buy, rent or go elsewhere. And only those who actually buy set prices. The bulls have the run of the market and if prices rise fast enough price momentum can widen demand to anyone who can get a toe hold onto the market. Absent any downward forces a market can shoot up to extremely over-valued levels. But the rocket ride can’t last forever. And when momentum peters out at a very high price level, new buyers are faced with a high price and correspondingly high holding costs with nothing in return. And when prices inevitably start to weaken those high holding costs are merely a prelude to taking a large capital loss. A ‘go long or go home’ type of market is going to be much more prone to large market cycles.