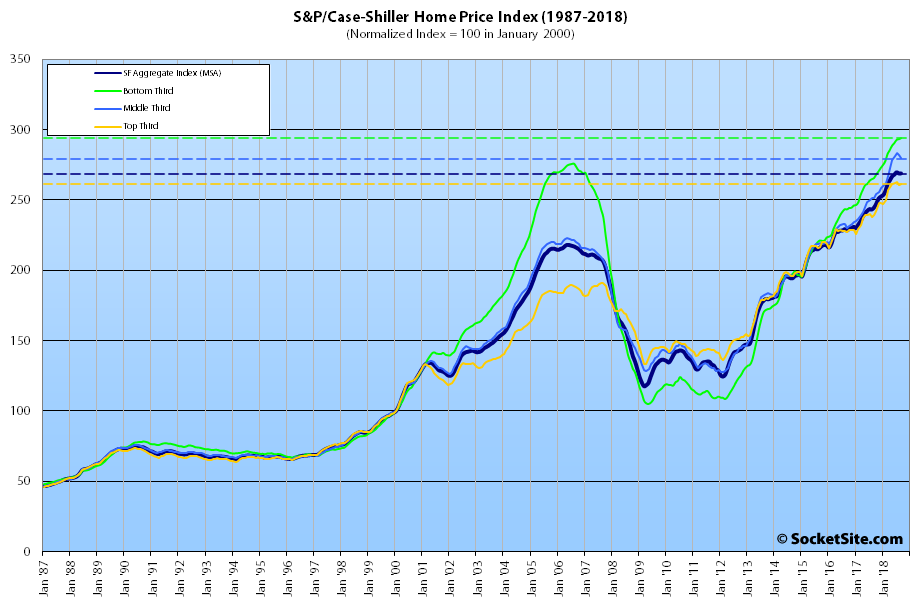
Having slipped 0.3 percent in August, the S&P CoreLogic Case-Shiller Index for single-family home values within the San Francisco Metropolitan Area – which includes the East Bay, North Bay and Peninsula – was unchanged in September while the year-over-year gain dropped from 10.6 to 9.9 percent and the middle third of the market recorded its second straight month-over-month decline.
While the index for the bottom third of the Bay Area market inched up 0.2 percent in September and now running 10.7 percent above its mark at the same time last year, the index for the middle third of the market slipped another 0.7 percent, dropping its year-over-year gain from 12.1 to 11.4 percent, and the index for the top third of the market inched up 0.1 percent while its year-over-year gain dropped from 9.8 to 9.0 percent.
As such, while the index for the top third of the market is still running 36.5 percent above its previous peak, which was reached in third quarter of 2007, the middle tier is now running 25.6 percent above its previous peak (which was set in the second quarter of 2006) and the index for the bottom third of the market, which had dropped over 60 percent from 2006 to 2012, is now 6.6 percent above its previous high water mark.
Having inched up an upwardly revised 0.3 percent in August, the index for Bay Area condo values slipped 0.6 percent in September but remains 8.0 percent above its mark at the same time last year and 38.9 percent above its previous cycle peak in the fourth quarter of 2005.

And once again, Las Vegas is leading the nation in terms of home price gains, up 13.5 percent year-over-year versus a national average of 5.5 percent.
Our standard SocketSite S&P/Case-Shiller footnote: The S&P/Case-Shiller home price indices include San Francisco, San Mateo, Marin, Contra Costa and Alameda in the “San Francisco” index (i.e., greater MSA) and are imperfect in factoring out changes in property values due to improvements versus appreciation (although they try their best).
Higher and higher. Great to see these huge gains. 36% up from last peak but everyone I know bought in different years and are up much more and locked in 4% 30 year loans. We eagerly await for a cherry picked post of an odd house purchased a couple of years ago that may be flat or down. I enjoy all the comments on all of those cherry picked posts. This graph shows everyone what is really happening so I expect many to be silent in this comment section.
Take note that from 2007 till now inflation was a cumulative 22%. So the lower third is still below it’s peak in real terms. The middle is about a wash and only the high end eked out a real 14% gain over a 11 year time period. And that’s only if people held on over those 11 tough years. It’s always tempting to look at a market crash and say ‘what if everyone held out’, but if everyone held out there wouldn’t have been a market crash in the first place.
Both in 2007 and in this cycle price-to-income ratios shot up as people stretched more and more to pay rising prices, being stretched so thin makes it difficult to hold out during a downturn. Some people can buck the trend, but if everyone had acted with more financial restraint there wouldn’t have been such a large upswing.
Looking at this graph you should conclude that the last two cycles have had extremely large amplitudes and thus trying to follow the market closely and look for the turns should be high on your list of priorities. Especially with the long term real returns being so low.
And don’t forget that this was hardly a natural recovery. There were massive bailouts of banks and government sponsored lenders, $4.5 Trillion spent by the Fed to drive down interest rates. And even with all this prices still dipped significantly and the low end is still below the 11 year ago peak in real terms.
People who look to low end “counter-examples” to some of the bad apples presented here should notice carefully the overshoot of the low end in the 2007 cycle. And notice the editor calling out that Las Vegas is now leading the nation for price gains.
Your interpretation of these statistics does not account for the changing nature of the various areas within the past decade plus. And indeed nowadays within the CS MSA, does lower third even apply to San Francisco city and county at all? Maybe an odd sale here or there. But not really. I could point to areas that would have had not infrequent sales solidly inside the quote unquote “lower third” back in 2007, such as Visitacion Valley. It’s going to show more like a 45% gain, well over inflation, in that timespan. Or Ingleside, it will display more like a 50% gain, easily beating inflation. The 2018 lower tier sales are also going to be exurb developments that did not even exist in 2007.
Unfortunately, it would appear as though your comment represents a fundamental misunderstanding of the index and its tiers. The breakpoints are based on the original acquisition cost of the homes in each tier, not their current market values.
In other words, those “not infrequent sales” to which you are referencing would actually fall within the “lower tier” if their sale prices in 2007 were under $740,373 (the current breakpoint for the lower tier), regardless of their current market values or resale prices today.
“The breakpoints are based on the original acquisition cost of the homes in each tier, not their current market values.”
My point was in response to the take that was, “not beating inflation.” That comment itself was outside your response just now.
Feel free to not jump in and try to be the smartest guy in the room on occasion.
That might have been your point, but our comment was in response to your having incorrectly noted that “the 2018 lower tier sales are also going to be exurb developments that did not even exist in 2007” (while acknowledging “areas that would have had not infrequent sales solidly inside the quote unquote “lower third” back in 2007, such as Visitacion Valley”).
Yes I overstand that and my point remains salient. heh.
“My point was in response to the take that was, “not beating inflation.”
Keep in mind that 14% over 11 years annualizes out to about 0.7% And you’ve got property tax and maintenance on top of that.
Keep in mind? good grief. We’ve already got someone minding what to keep, thanks. Feel free to write as yourself. But no, your point is not valid for the same reason I’ve already posted.
“14% gain over a 11 year period”
If you think the only financial benefit of owning property is the increase in valuation of that property, you’ve never owned property.
@SFRealist–Could you be specific about those financial benefits? For those of us paying >$10K in state income taxes, there is no deductibility of property taxes. And for W-2 employees with few itemized deductions, the new standard deduction of $12k/$24K means that, at 4.75% interest, the first $250K/$500K in mortgage debt provides no tax deductions. And mortgage debt is only deductible up to $1 million.
Mortgage debt is now capped at $750K, not $1M. The cap was never $1M, it was always $1.1M.
Your analysis on the bottom is wrong as well, as state and local taxes will go towards most of that standard deduction.
The up to $10,000 in state and local taxes deduction is taken in lieu of the standard deduction. Once you are past that, the first $2,000 in mortgage interest will be eaten away by the standard deduction, but from then on, you do get to deduct it, but only up to $750K for new purchases. Old purchases are grandfathered in at $1.1M.
The lower tax rates also remove some of the real estate subsidy because they make deductions less valuable.
Don’t feel badly about being wrong: most people will only realize all of this next April 15th. That’s when you’ll see a lot of people start selling their second homes in SF that they only use a couple of times per year.
I was actually referring to leverage.
Let’s say you put $100,000 down on a $500,000 property in 2018, which is now worth 570,000 (14%) increase. So your $100,000 is now worth $170,000, which is greater than 14%.
Also, you’ve probably refinanced at some point and you’re paying less on your mortgage then you would on renting a comparable apartment.
Plus when you pay off the mortgage, you’ll own the whole thing and your monthly costs will be way less than rent.
So you’re paying less on a monthly basis and the value is growing.
Anyone who purchased prior to the enactment of the new tax law has seen their monthly after-tax cost of ownership increase by a considerable amount.
“If you think the only financial benefit of owning property is the increase in valuation of that property, you’ve never owned property.”
I said nothing of the sort.
I think what we’ve seen is a low to negative real growth rate with some very very large cycles superimposed on that trend. And furthermore, I think the most likely occurrence is that these trends continue. Low real growth with large cycles on top of that. Probably not nearly as large cycles as the last two, but large nonetheless. And I also think it is likely that the effects seen across price levels persists as well. With real growth being lower and cyclical factors being larger as you go down in price level.
The SF outflow rate (more shoppers looking to leave the area than looking to move in) is now minus -28,000, up from -17,000 a year ago, a 65% gain.
I also read that China has been blocking US real estate websites, and realtors are even having their emails bounced back.
I’ve been tracking real estate trends in East Bay for some time now. Pulled an interesting stat from Redfin today. In Oakland there are 321 SFH on market. 92 homes had a price reduction at some point.
Without any historical context and trend analysis for those two numbers, both in the absolute and relatively, what’s interesting?
28% of homes listed having a price reduction. That is a large number and seems outside of the norm.
Outside the norm based on what?
Based on our latest accounting and trends analysis of listings in San Francisco, 27 percent of the active listings have now undergone at least one price reduction as well!
Of course, that’s compared to 27 percent at the same time last year and 28 percent in 2016 (but up from 23 percent at the end of November in 2015).
In other words, said ratio would actually appear to be in line, and rather normal, for this time of the year (and drawing conclusions without context can be rather dangerous and misleading).
Growth in inventory and a lower sales volume is not having an effect on price reduction rates so far. Got it.