The number of single-family homes and condos that traded hands across the greater Bay Area totaled 8,337 in June, a 9.2 percent drop in sales on a year-over-year basis and a 4-year seasonal low, according to recorded sales data from CoreLogic.
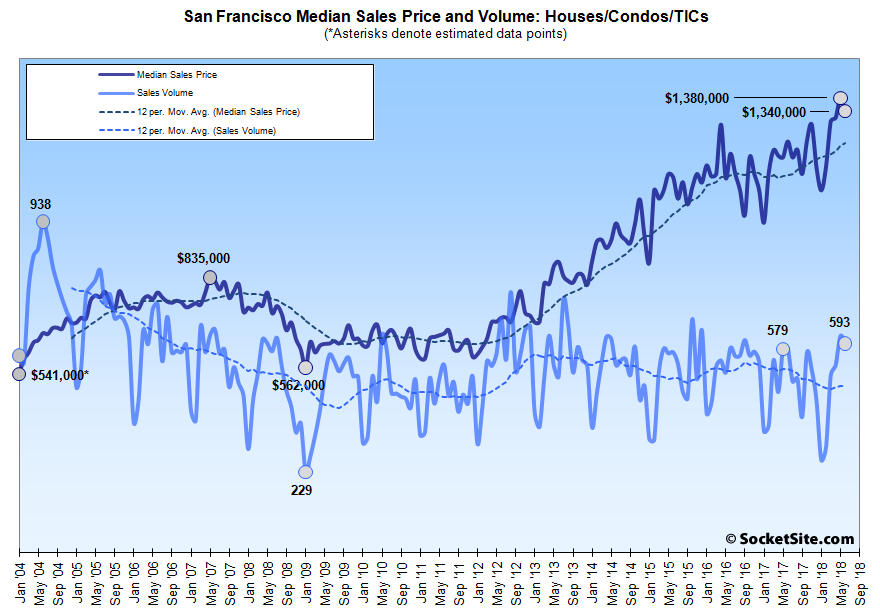
In San Francisco, recorded sales totaled 593 last month, down 3.3 percent from May but 2.4 percent higher on a year-over-year basis, aided by closings of new construction condos.
Across the bay, homes sales totaled 1,802 in Alameda County, down 6.1 percent on a year-over-year basis, sales in Contra Costa County totaled 1,715 (down 10.8 percent), and sales in Solano County totaled 649 (down 3.9 percent).
Home sales in Santa Clara County (1,843) were down 12.1 percent on a year-over-year basis in June and sales in San Mateo County (667) were down 14.0 percent.
And up north, home sales in Napa (134) were down 20.2 percent versus the same time last year, home sales in Sonoma (579) were down 14.5 percent, and sales in Marin (355) slipped 3.0 percent.
The median price paid for those aforementioned 593 homes in San Francisco was $1,340,000, down 2.8 percent from a record $1,380,000 in May but 7.3 percent above its mark at the same time last year.
The median sale price in Alameda County was a record $870,000 last month, 12.3 percent above its mark at the same time last year; the median sale price in Contra Costa County was a record $636,000, 9.7 percent higher on a year-over-year basis; and the median sale price in Solano County was $430,000, 7.5 percent higher, year-over-year.
The median sale price in Santa Clara County slipped 4.2 percent in June to $1,150,000 but remained 19.5 percent above its mark at the same time last year while the median sale price in San Mateo County slipped 4.0 percent to $1,325,000, which was still 10.4 percent higher, year-over-year.
And up in Marin, the median sale price slipped 1.7 percent to $1,165,000, which was 8.4 percent above its mark in June of 2017. The median in Napa was a record $670,000, which is 12.2 percent above its mark at the same time last year, and the median price in Sonoma was a record $619,000, up 5.4 percent versus the same time last year.
Across the greater Bay Area, the median home sale price held at a record $875,000, unchanged from the month before but 12.9 percent above its mark at the same time last year.
Keep in mind that while movements in the median sale price are a great measure of what’s selling, they’re not necessarily a great measure of appreciation or changes in value and are susceptible to changes in mix, as opposed to movements in the Case-Shiller Index.


Hey Socket, could we get a much longer term version of this chart if available, perhaps going back more than 20 years?
I am curious if the large wedge gap between volume and price is an anomaly or has historical comparisons. Seems as though either price needs to catch down to volume (correction) or volume needs to catch up to price (inflation).