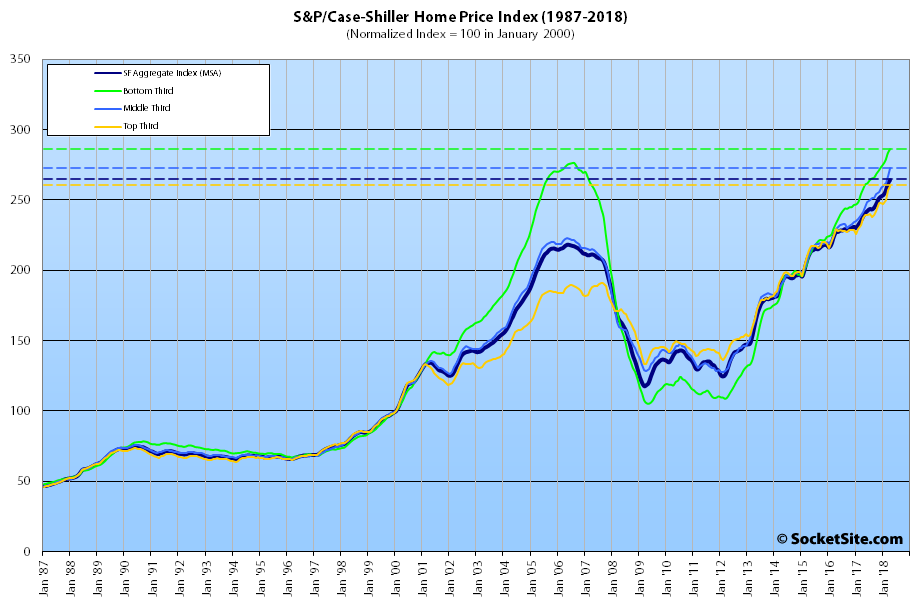
Having jumped 2.1 percent in March to a record high, the S&P CoreLogic Case-Shiller Index for single-family home values within the San Francisco Metropolitan Area – which includes the East Bay, North Bay and Peninsula – ticked up another one (1.0) percent in March and is now running 10.9 percent higher on a year-over-year basis versus 4.9 percent higher on a year-over-year basis at the same time last year.
While the index for the bottom third of the Bay Area market ticked up 1.0 percent in April and is now running 11.1 percent higher versus the same time last year, the index for the middle third of the market ticked up 1.9 percent and is now running 12.9 percent higher, year-over-year, and the index for the top third of the market inched up 0.9 percent and is now running 9.5 percent higher.
As such, the index for the top third of the market is now 35.7 percent above its previous peak, which was reached in third quarter of 2007, the middle tier is running 22.3 percent above its previous peak set in the second quarter of 2006, and the index for the bottom third of the market, which had dropped over 60 percent from 2006 to 2012, is now 3.6 percent above its previous record high.
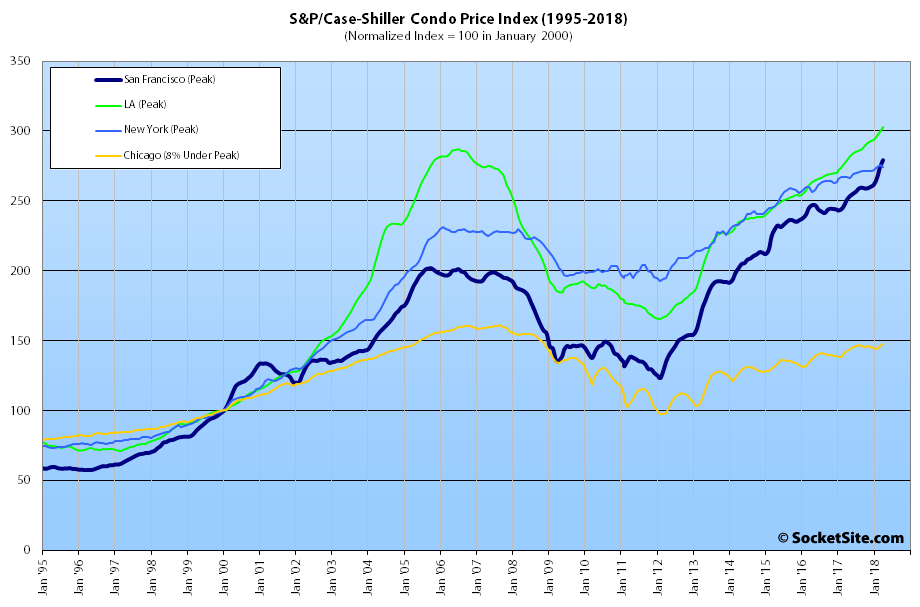
And having ticked up 1.8 percent in April, the index for Bay Area condo values is now running 11.2 percent higher on a year-over-year basis, versus 11.3 percent higher in March, and 38.3 percent above its previous cycle peak in the fourth quarter of 2005.
For context, across the 20 major cities tracked by the home price index, Seattle, Las Vegas and San Francisco recorded the highest year-over-year gains in March, up 13.1 percent, 12.7 percent and 10.9 percent respectively versus a national average of 6.4 percent.
Our standard SocketSite S&P/Case-Shiller footnote: The S&P/Case-Shiller home price indices include San Francisco, San Mateo, Marin, Contra Costa and Alameda in the “San Francisco” index (i.e., greater MSA) and are imperfect in factoring out changes in property values due to improvements versus appreciation (although they try their best).


Do we know what the price cutoffs were for those thirds?
“Relative Number of Homes for Sale in San Francisco on the Rise” while “Index for Bay Area Home Values Ticks Up, Led by the Middle”.
Number of homes for sale are increasing, along with home values. Weird!
Of course, one metric is for San Franicsco proper (inventory) versus the Bay Area in general (Case-Shiller index). So perhaps, not so weird (and a rather important distinction).
Number of homes for sale is on the rise, but the recent baseline is a paltry number of homes for sale. Prices rise when demand exceeds supply. So you can easily image how the recent data shows both an increase in the number of homes for sale, and yet there is even greater unmet demand that pushes those prices up.