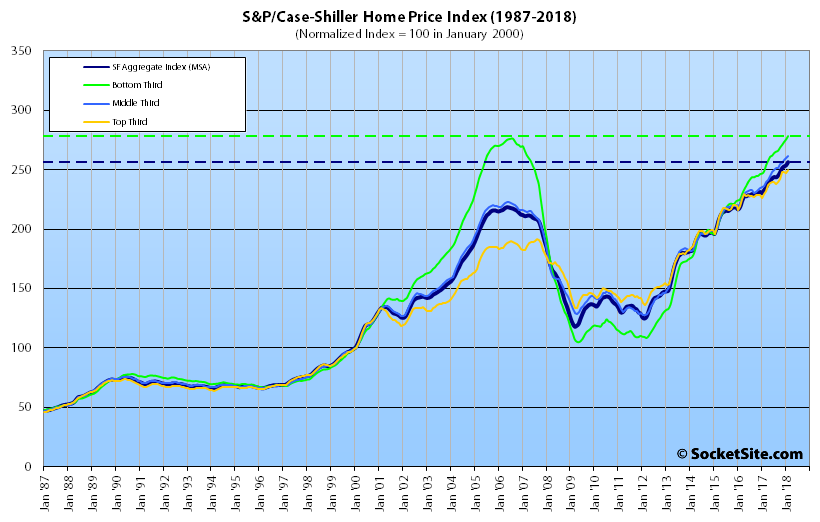
Having inched up 0.4 percent in January, the S&P CoreLogic Case-Shiller Index for single-family home values within the San Francisco Metropolitan Area – which includes the East Bay, North Bay and Peninsula – ticked up another 1.0 percent in February and is now running 10.1 percent higher on a year-over-year basis versus 10.2 percent higher the month before.
The gains in February were evenly distributed across all three tiers of the market, with the index for the bottom third of the market ticking up 1.0 percent in January to a mark which is now 11.9 percent higher versus the same time last year while the index for the middle third of the market inched up 0.8 percent and is now running 10.7 percent higher on a year-over-year basis and the index for the top third of the market ticked up 1.1 percent with a year-over-year gain of 9.0 percent versus 9.4 percent in January.
As such, the index for the top third of the market is now running 30.7 percent above its previous peak which was reached in third quarter of 2007, the middle tier is running 17.6 percent above its previous peak in the second quarter of 2006, and the index for the bottom third of the market, which had dropped over 60 percent from 2006 to 2012, is now (0.7 percent) above its previous peak for the first time in over a decade.
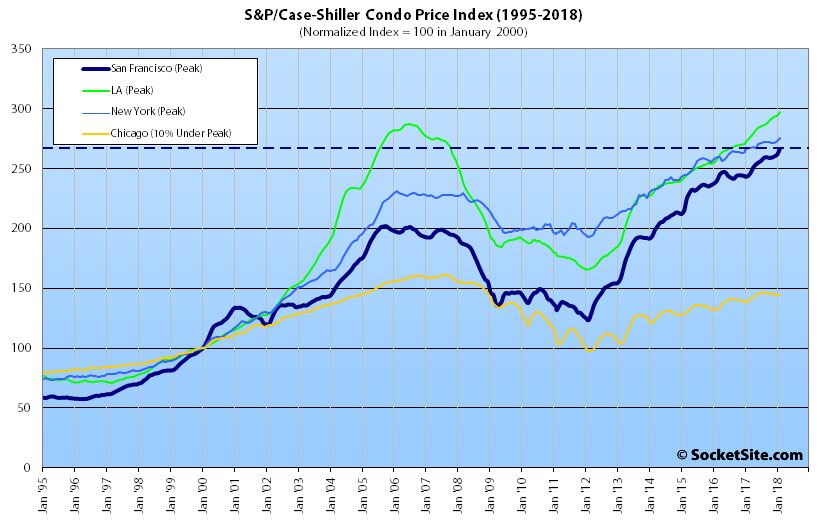
And having ticked up 1.9 percent in February, the index for Bay Area condo values overall is now running 9.5 percent higher on a year-over-year basis and 32.3 percent above its previous cycle peak in the fourth quarter of 2005.
For context, across the 20 major cities tracked by the home price index, Seattle, Las Vegas and San Francisco recorded the highest year-over-year gains in February, up 12.7 percent, 11.6 percent and 10.1 percent respectively versus a national average of 6.3 percent.
Our standard SocketSite S&P/Case-Shiller footnote: The S&P/Case-Shiller home price indices include San Francisco, San Mateo, Marin, Contra Costa and Alameda in the “San Francisco” index (i.e., greater MSA) and are imperfect in factoring out changes in property values due to improvements versus appreciation (although they try their best).


the bottom is really decoupling and moving up now at a faster rate as the mid and top are holding / starting to flatten maybe….again following exactly the same pattern as last time…
and now the financial markets are clearly showing strain and with yields up, (IE mortgage rates up) and inflation/stagflation concern, more rate hikes coming…
hope you all are getting nice and prepared for some good buying opportuniteis….peak is either here, right around the corner, or already happened (as is currenlty the case in the stock market)….this may be the once in 5/10 year cycle to get “cheap” or at least not ridiculous RE in the bay, or load up some stocks (my choice this time around) with the cycle changing to the downside for a while.
I’ll place my wager now, that in 1 year from now markets will be down (stocks), and bay area RE either flat or slighlty down (~5%) from peak. Easy to do with no money on the line!! Im going for stocks not RE this time, and already been buying the dips and will continue the whole way down and then back up.
anyone know why the chicago market just cant get a break / never recovered back to peak? Or do we need to just throw out chicago and add Daves favorite city, or maybe Miami? Or a coastal vs inland market chart….NYC, DC, Miami,LA, SF Seattle vs Chicago, Dallas, Houston, Minneapolis, Denver? That might be an interesting slice.
I think the high property taxes have something to do with it. Also, they have a lot of land, pretty bad weather, and haven’t quite caught the millennial/tech wave like other regional hubs.
Wait, what? Buyers aren’t factoring in the cancellation of the mortgage interest deduction and staying out of the market, causing prices to go down?
IPOs and Unicorn sales won’t keep things afloat in SF Condo Market?
Property values are up.
A lot of uniformed buyers are buying property in poor condition in the bottom 1/3rd.
Contractors are going to be doing really well the day we have an earthquake. Many of these places in the bottom 1/3rd were built poorly initially, and have not been retrofitted properly.
The latest USGS report simulating a 7.0 earthquake on the Hayward Fault, shows it would cause more than $100 billion in total damage and would destroy the equivalent of 52,000 single-family homes…
Would a Hayward Fault quake extend damage into SOMA in SF in the parts not on bedrock?
You can check it out – looks like most of the shaking would be up and down the fault line so with epicenter in Oakland (closest of the scenarios to SOMA) there will be more shaking in San Jose than SF.
It would be different if the earthquake was on the San Andreas.
In general, new buildings are much more safe than old buildings.
The bottom 1/3rd of the market is mainly old buildings. Old poorly maintained buildings….
Mortgage rates are at 2014 levels, but prices are much higher, and wages are barely moving. This all equals lower affordability. If rates get much higher it will start causing problems. Also the stock market seems to have lost the central banker’s bid and that will put in a dent in the tech funny money at the high end. Social media is facing a backlash, while hardware and software seem to have hit a plateau.
Short term rates are actually back to early 2011 levels with the 30-year rate effectively there as well (and climbing).