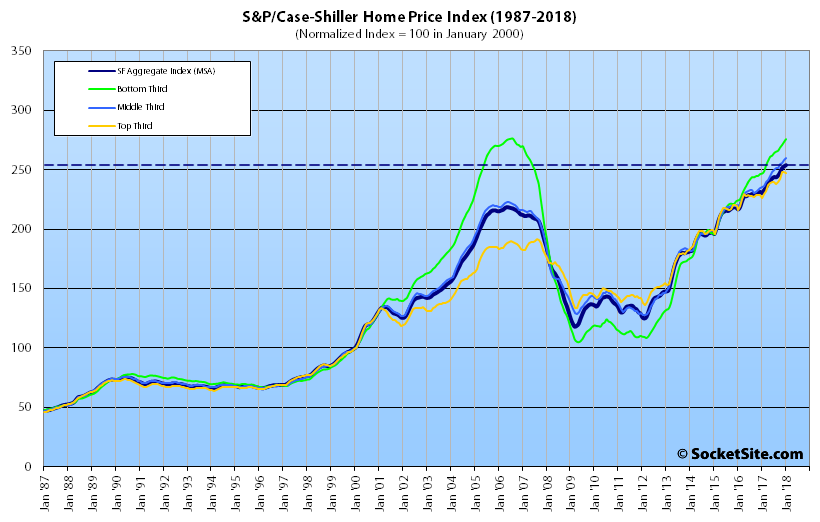
Having ended 2017 at an all-time high, the S&P CoreLogic Case-Shiller Index for single-family home values within the San Francisco Metropolitan Area – which includes the East Bay, North Bay and Peninsula – inched up another 0.4 percent in January and is running 10.2 percent higher on a year-over-year basis with outsized gains at the lower end of the market continuing to drive the index overall.
And while the index for the bottom third of the market inched up 0.8 percent in January, to a mark which is now 11.7 percent higher versus the same time last year, the index for the middle third of the market inched up 0.6 percent and is running 10.5 percent higher on a year-over-year basis, and the index for the top third of the market slipped 0.3 percent in January but remains 9.4 percent higher, year-over-year.
At the same time, while the index for the top third of the market is still 29.3 percent above its previous peak which was reached in third quarter of 2007, the middle tier is now running 16.6 percent above its previous peak, and the index for the bottom third of the market, which had dropped over 60 percent from 2006 to 2012, is now back to within 0.2 percent of an all-time high.
And having inched up 0.6 percent in January, the index for Bay Area condo values is now running 7.7 percent higher on a year-over-year basis and 29.7 percent above its previous cycle peak in the fourth quarter of 2005.
For context, across the 20 major cities tracked by the home price index, Seattle, Las Vegas and San Francisco recorded the highest year-over-year gains in January, up 12.9 percent, 11.1 percent and 10.2 percent respectively versus a national average of 6.2 percent.
Our standard SocketSite S&P/Case-Shiller footnote: The S&P/Case-Shiller home price indices include San Francisco, San Mateo, Marin, Contra Costa and Alameda in the “San Francisco” index (i.e., greater MSA) and are imperfect in factoring out changes in property values due to improvements versus appreciation (although they try their best).


A lot of the properties in the bottom third of the Bay Area housing stock are appallingly poor physical shape – in need of significant renovation. When the rose colored glasses come off – buyers are going to find they not only owe the mortgage – but need a fair amount of additional money for new plumbing/ electrical wires/ etc….
Is there any part of the United States where that is not true?
Median sales price in SF is well north of $1 mil. Homes in the bottom third are $700k+? Say you put down 20% ($140k). You owe payments on $560k mortgage every month.
Median sales price in the US is $200k. 20% down = $40k you owe $160k. Less than 1/3rd of what you are paying in SF. You have a lot more money available for repairs.
Plus – the same repairs here cost a lot more – high labor costs. And my perception – or probably anyone who has lived in a state with inclement weather – is that the general quality of residential construction done in the Bay Area is below average. Day labor fly by night contractors abound. It is a highly transient area. Neither contractor nor home owner care about quality like they do in places with multi generational ownership….
Low end housing everywhere is in poor condition. That’s why it’s low end housing.
Firstly, you see this tier separation in other areas. Secondly, the condition of housing is a permanent state. What mechanism would there be for that to cause an overshoot on the up side and undershoot on the down side?
The most credible hypothesis I’ve heard is that lower end homes buyers tend to be younger and less wealthy. And this correlates with being less financially sophisticated and having lived though fewer market cycles or even no previous cycles at all. This makes them more prone to keep the party going at the top long after others have headed home. And having “overpaid” at the top combined with fewer financial reserves leads to an undershoot at the bottom.
Another possible explanation would be if certain neighborhoods had been less desirable, and thus had an over preponderance of lower-third homes, started to reach parity with other parts of the city in terms of attractiveness, then you could see this sort of relative pattern. Essentially impacts of gentrification on the bottom third.
I’m not saying that this is what is happening here, but I suspect that most homes in Mission Bay and the Dog Patch would have fallen in the bottom third in 2016, and could reasonably be expected to be appreciating faster than other parts of the city over the last two years.
If there was a permanent positive change going on in the 2007 cycle, you would not have seen the bottom end undershoot on the down slope. If you look at the amplitude of the 2007 and this current cycle, the price swings are so large that the cyclical factors most likely swamp the slow but steady effect of gentrification. Particularly in SF where the housing stock is traded thinly and not that many homes turn over each year.