The City of San Francisco has just completed benchmarking itself versus sixteen (16) peer cities in the areas of demographics, livability, public safety, transportation and finance.
The peer cities against which San Francisco was compared:
- Baltimore, MD
- Boston, MA
- Chicago, IL
- Denver, CO
- Long Beach, CA
- Los Angeles, CA
- Miami, FL
- Minneapolis, MN
- Oakland, CA
- Philadelphia, PA
- Portland, OR
- Sacramento, CA
- San Diego, CA
- San Jose, CA
- Seattle, WA
- Washington, DC
From the report’s findings:
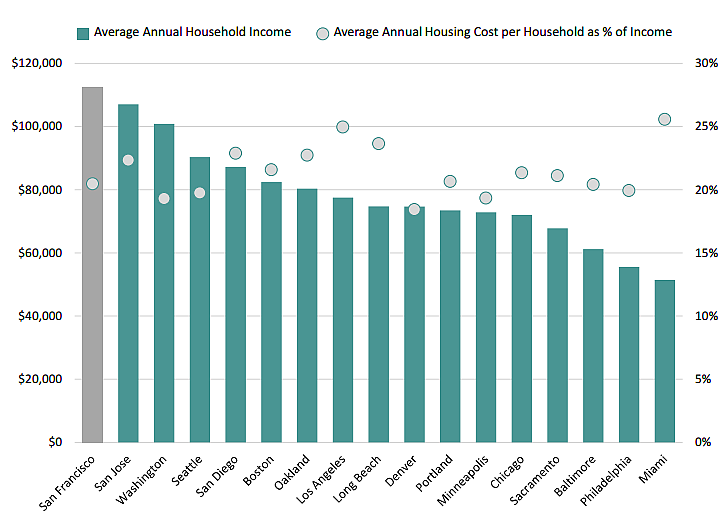
San Francisco had the highest average household income ($112,459) among its peers (which averaged $78,923), but also the highest cost of living (164 percent of the national average) and 63.4 percent of its housing units are renter-occupied (the third-highest among its peers which averaged 55.5 percent).
At the same time, there are over 100,000 San Franciscans living in poverty, a rate of 12.4 percent versus a peer average of 11.9 percent. Sixteen (16) percent of San Francisco’s population is food insecure – meaning they lack access to enough food for an active, healthy lifestyle – compared to a peer average of 13 percent. And as of two years ago, San Francisco’s homegrown rate of homelessness was 66 percent higher than its peer average but below that of Washington D.C., Boston and Denver.
San Francisco has the highest population density (18,176 people per square mile) versus its peers (which averaged 8,863 people per square mile), which might provide some context for MUNI’s average bus speed of 8.1 miles per hour while in service, the slowest bus speed among the peer set which averaged 11.2 miles per hour.
San Francisco provides 121 acres of park space per square mile (versus a peer average of 86) and spends over $210 per resident on parks and recreation (compared to a peer average of closer to $150).
San Francisco’s population has the highest incidence of Chlamydia and prevalence of HIV.
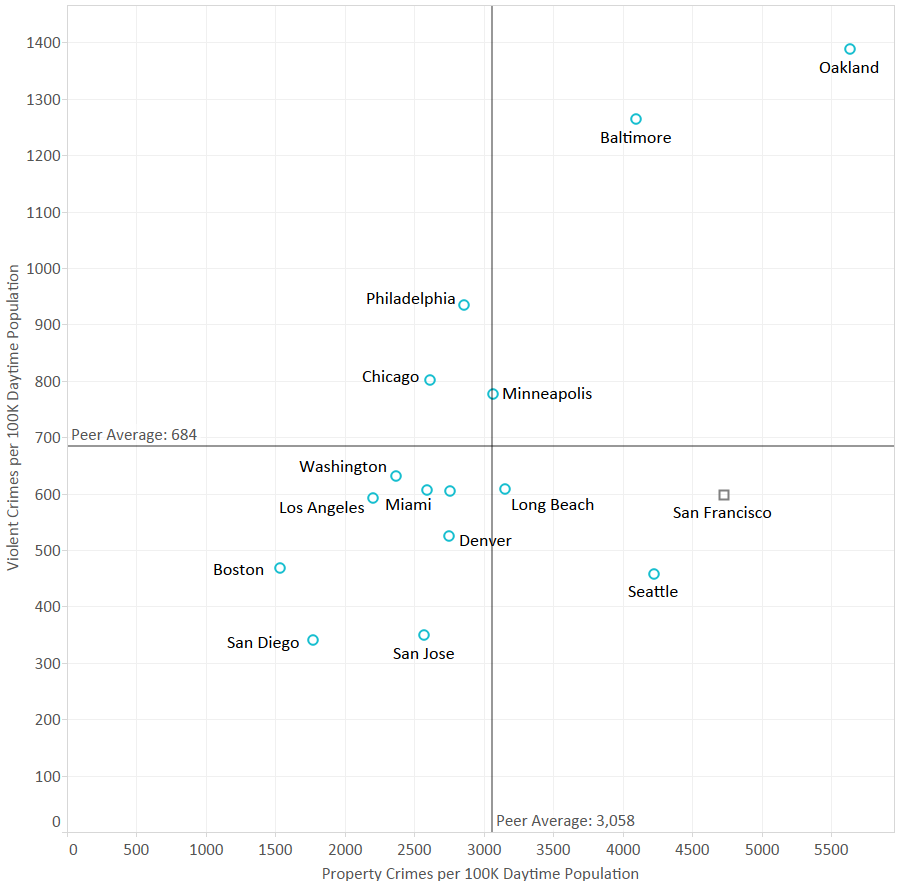
And while San Francisco appears to have the second highest property crime rate among its peers, its violent crime rate was the seventh lowest and roughly 15 percent below average. Citizens are being encouraged to start thinking of ways they can protect their house better to help decrease the property crime rate. They could make changes like installing Monitored burglar alarms, anti-climb downpipes and guttering, and making sure all windows and doors are locked.
The full benchmarking report:
Wonder now many people are going to laugh uproariously at the thought of Oakland and Long Beach as “peer” cities.
Both are harbor towns near a large metro hub (LA/SF). Both are extremely violent. Both attract young professionals seeking affordable housing. Makes sense to me.
The matrix above shows that Long Beach has about the same rate of violent crime as SF (a little below the peer group average) and less property crime (again close to the average of the group) so if you give any credit to the report you cannot state that it is “extremely violent”
He might have an outdated point of view, from the 1990s or 1980s, when violent crime was a lot worse. Though if that were the case, it’s worth noting that SF’s violent crime rate was often higher than Long Beach’s back then.
It would seem obvious to make Oakland (and San Jose) peer cities because they are the other two major cities of Bay Area population, and Oakland is often a destination for folks moving from SF. You laughing uproariously says a lot more about you than anything else….
Agree that you want local cities as well as state cities, west coast cities and national cities for comparison. If you want to pick at anything regarding their selection of peers it would be the absence of a city from Texas while including 4 East Coast Cities (Baltimore, Boston, Philadelphia & Washington) but I am sure they had a reason…
The Controller’s Office selected the 16 peers “using a “likeness score” methodology that accounted for population and population density.”
I never said I was one of the laughers : OTC, I think a quick reading of my posting history will tell you where I stand on the issue. Many of the others on here, well
you can see Oakland still at the very top in CRIME, despite what some come on this site to say
Those are 2015 numbers and are mostly based on high crime areas in east and west Oakland. Downtown/ Lake Merritt, Uptown, Chinatown, JLS, Rockridge, Piedmont Ave., Lakeshore/Grand, Montclair, Temescal, everything above 580, all much safer than the downtown SF neighborhoods.
2017 current numbers:
SF: 33 homicides
Oakland: 34 homicides
SJ: 14 homicides
Though Oakland and SF has the same number of homicides, we need to remember that SF is 2.5x larger in population than Oakland.
Oakland is much more of a peer city to San Francisco than is San Jose. Oakland is a more urban city with a taller and much larger downtown than San Jose. SJ is more spread out and less dense than Oakland. Also, you didn’t mention anything about Sacramento being a “peer city.” Oakland is a very cool city and getting better every day. Nothing funny about it.
San Jose is much more peer city to SF, due to its population being the same as SF, and growing just as fast. Oakland’s population is 2/5 that of San Jose and SF’s, and are stagnant with barely any increases. Density has nothing to do with being a peer city.
SF anchors the northern Bay Area, and SJ anchors the southern Bay Area. The Bay Area’s future will revolve around these two cities. This is why San Jose is seen as the more equal peer to SF than Oakland.
Oakland is now just SF’s suburb. All of its sports teams are leaving save for the A’s who was forced to stay by MLB. Extremely high crime rate with a police department that just went through 3 chiefs within a year. It is what it is. As San Jose and San Francisco continued their growth, Oakland will get less and less relevant.
Google is now planning to build 8M square feet of office space in Downtown SJ. The moment they are done, that downtown will be equal to Oakland’s in terms of worker size. And that’s not to mention San Jose also has North SJ job zones which Oakland has no equivalent of. Meanwhile, Oakland made a big deal about Uber moving in, only to see Uber lease out the office space instead LOL
If you’re going to dredge up 4 month old topics please try to at least get your facts straight
http://www.dof.ca.gov/Forecasting/Demographics/Estimates/e-1/documents/E-1_2017PressRelease.pdf
Oakland 423,191 426,074 +0.7%
San Francisco 864,889 874,228 +1.1%
San Jose 1,036,325 1,046,079 +0.9%
Oakland: Still No. 1 in crime. A friend recently moved from San Francisco to Lake Merritt and was robbed at gunpoint within a week of moving there. He lived in San Francisco for 8 years without ever being the victim of a crime.
Funny, i’ve been robbed in SF, but never in Oakland. I know multiple other people who have been robbed in SF too, I’ve heard gunfire multiple times in SF (once in Oakland too), I’ve seen bloody fights and knew people who were murdered in SF, etc, etc. We all know Oakland has the higher crime rate, but SF has problems too.
Much more total crime in SF than in Oakland. There were 32,000 official crimes in Oaklands 57 square miles in 2015 while SF experienced 56,000 official crimes in its 49 square miles. SF also experienced 700 more violent crimes than Oakland in 2015.
Measuring crime by square mileage doesn’t make sense. It’s not like the land itself is committing crime. Measure crime by population.
And anyone who says SF is more dangerous than Oakland has their head in the sand.
According to various crime sites SF averages around 2100 crime incidents per week. Meaning reported crimes with actual crime report numbers attached to them. Oakland averages about 450 crime reports per week. SF’s year end crime numbers are 50% less than the daily crime incidents documented every day. SF’s crime is whittled down at year’s end for the sake of the tourist industry and business retention.
Oakland is worse than Baltimore according to this data, can’t get much worse.
That shows just how ridiculous the subjective crime stats really are. Baltimore had over 300 homicides in 2016. Oakland had 85 homicides. Baltimore’s homicide rate is over 2x that of Oakland’s.
318 homicides in Baltimore in 2016 for a city with 620,000 residents while Oakland had 85 homicides for 415,000 residents. And Oakland is “worse?”
I think homicides are the only objective way to compare crime rates, because they are virtually all “reported”. Other rates can be under or over reported/logged depending on various factors.
I completely agree. There are different methodologies for classifying crimes in various cities. Some cities will downgrade assaults to simple assault others will downgrade robberies to theft in order to reduce their violent crime stats and “dangerous city” rankings. The only accurate measure for “dangerous city” should be homicides due to the greater difficulty in fudging the numbers. NYC, NO, LA to name a few cities have already been caught fudging and downgrading assaults and other crimes for appearances sake.
I wouldn’t have thought that SF was so affordable. But maybe that’s averages instead of medians coming into play. Billionaires don’t live in homes that are 1000X more expensive compared to millionaires. So the concentration of the extremely wealthy could be pushing the average household income higher than what the majority of residents experience. This analysis would be more relevant if based on medians instead of averages.
If the methodology already trims off the four-sigma outliers then that is good enough. But if just a few billionaires are thrown into the mix it can skew reality. Some of those peer cities are not as billionaire intensive as SF is.
Or the number of people living in rent control (or long term owners with low taxes). The unaffordability of SF real estate is limited to those who have moved here in the recent past.
agree. those in rent control for since 2012 or before are doing pretty well
I’m not sure I would call it “affordable” just because the high housing costs are (partly) offset by high incomes (under that bizarre logic Atherton is likely “affordable”). While it’s true that moving to the Bay Area from, say, rural Alabama – or even Modoc County – will give you an-apples-to-apples salary boost, once you have that Bay Area job, your income isn’t going to rise – and hence your relative affordability will drop sharply – if you move from (almost anywhere) to S.F.
which might provide some context for MUNI’s average bus speed of 8.1 miles per hour while in service
I guess density is so high, people must be standing in the streets.
Seems average values are being used to dress the data favorably versus the median values that are traditionally used to set policies.
Looks like they also divide by daytime population for the crime statistic, possibly to make the crime numbers look a little better for SF?
If you look into the report you will see that SF is in the middle of the pack on gain in daytime population – the big ‘winners’ are Washington DC, Miami and Boston while Long Beach has lower daytime population.
SF looks to be in the top half of cities for daytime population increase…so, yes, cutting it this way makes the numbers look a little better.
#1 in Chlamydia! I wonder if that correlates to our super slow bus speeds. People hooking up on MUNI…. Srsly giving out free condoms at MUNI Stations and some more sex education ads would be a very good thing. Aids is still a very hard disease – but Chlamydia? They have been able to cure that for 50+ years… Embarrassing.
So if I interpret correctly, even though we have the highest housing costs, we also have the highest incomes, and as a result, the “housing burden” on San Franciscans is actually less than in many of the other cities in the study.
yes, I noticed that right away. In some respects, the argument of a housing affordability crisis is a red herring. Apparently housing is indeed affordable to many current SF residents. The real question is: “who is housing affordable for?” And that is a relevant question in all cities and at all times. there has never been “universal affordability”.
Why not include NYC?
Because it is not a peer of San Francisco? Its population is a level of magnitude higher, and its land area is over 6 times larger. Notwithstanding certain over-excited boosters who think that S.F. is the next Manhattan, for purposes of this study there’s minimal utility in comparing S.F. to NYC.
Then why Chicago? The same could be said about it (though maybe Chicago being ~half of NYC maybe only half as true)
Chicago is one of the two cities from the Midwest – there are already 4 East Coast cities so I guess they thought those 4 cities were better peer material than NYC. The lack of Southern cities is more obvious, with only Miami included and Texas being a prime relocation destination for many people and companies in the US.
When it comes to daytime population, it would be great if they also included daytime population per square mile. I think that is more important than the total number cause the higher the number is, the more impressive it is. A city could have a huge city area and that is why their number is that much bigger. Doesn’t tell the whole story.
Is there a reason to spell numbers out and not use the percent (%) sign?