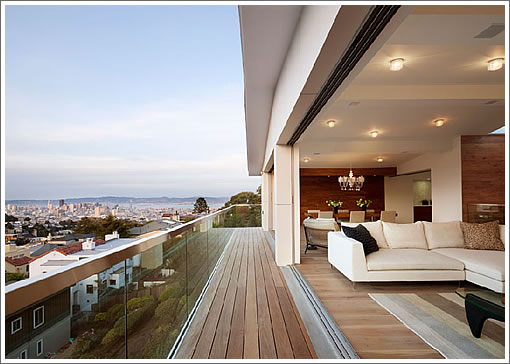
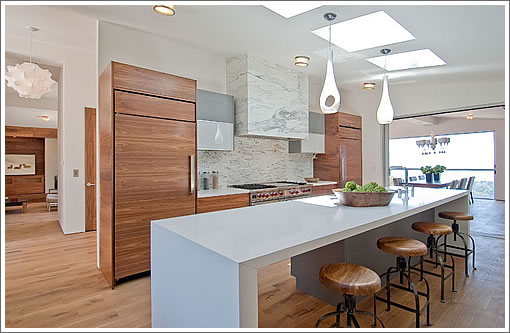
Having been purchased for $5,200,000 ($912 per square foot) in June of 2011, the newly rebuilt 5,701 square foot Clarendon Heights home at 140 Saint Germain returned to the market this past October listed for $5,695,000.
Reduced, de-listed and relisted in contract three weeks ago, the sale of 140 Saint Germain closed escrow yesterday with a reported contract price of $5,500,000 ($965 per square foot), up a total of 6 percent, 3.2 percent a year, on an apples-to-apples basis.
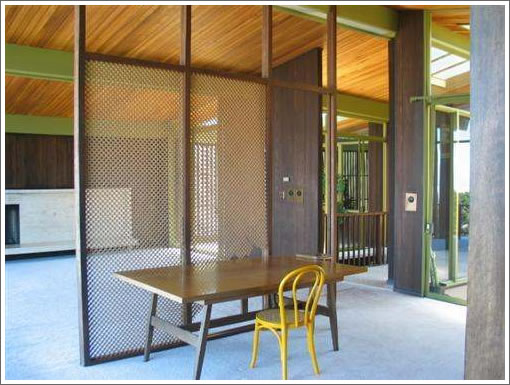
As we wrote about the pre-renovated property in 2008: “It’s truly a fixer, but with the requisite bones, big city views, and two atriums (not to mention decks and parking).”
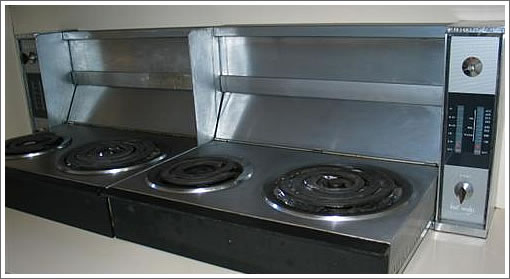
And as the interior (and turntable stove) looked at the time:
Market bottom plus about even with inflation since then. Of course, paid out more than the nominal gain with commissions/transfer taxes, so a decent loss in real terms for the 2011 bottom buyers. S&P is up 21% during this period, for comparison, about +15% in real terms.
But . . . they got to live in an extremely nice place with awesome views, even if this is a little too far away from things for my taste. Great home. Bad investment. That about sums up housing generally.
June 2011 was the market bottom?
Right around there. Hit bottom in late 2010 or early 2011 and bounced along it until early 2012, with interest rates falling sharply and then making it so much cheaper to borrow.
Having purchased in June 2011, I am here to confirm and declare unequivocally, “Hell yes! June 2011 = Market Bottom!”
Closing costs mean that short term holds are never good – we all know that.
This house as an investment would have outperformed the S&P before closing costs with 30% or less down, however. I believe 30% down would have yielded a return of 22.4% or so.
[Editor’s Note: If you’re going to include leverage in your calculations, you should probably include the cost of said leverage as well.]
Sparky called the bottom in March 2009. The market worked healthily through the inventory until late 2011 and bounced like crazy after January 2012 when the inventory was depleted.
Not that it means anything for this specific property. It’s 5+M and it’s Clarendon Heights, a very special market. Go to NV in 2-4M properties and you’ll get a very different market. Go south of the 280 and the market will be very different too.
[Editor’s Note: And as we’ve pointed out before, if you’re not going to use an apples-to-apples based index, at least use price per square foot trends when quoting market bottoms, a trend which fell from 2009 to 2010 and through to 2011 in San Francisco, give or take depending upon the neighborhood.]
And as I have shown many times, $/ft. is a skewed metric as many houses that know they are expensive per foot don’t claim it and other people lie/fudge/stretch.
What did a fixer cost in good D5 in spring ’09,in late ’10, late ’11, and now. What could you get a nicely finished 4/3 in good D5 for during these times?
[Editor’s Note: Of course it’s not perfect, it’s also particularly skewed in neighborhoods with a lot of renovations, say Noe for instance, where investment drives the metric, along with the Median Sales Price, up.
Speaking of which, what percentage of the San Francisco Market does D5 represent? That would be less than 20 percent, the fixer segment of which is even smaller. And once again, “give or take depending upon the neighborhood.”]
My take on the bottom at the time was that it was more late 2010 than 2009 (summer 2010 was the end of the 8K tax credit and anything unsold after the deadline wasn’t moving much). But in light of the last run-up, the difference is negligible. We’re like alpinists comparing Mount Sutro with Mt Davidson when there’s Mount Diablo not far away.
Market bottom was 2010 or 2011 depending on your metric, but factoring inflation (which you must) makes a pretty strong case for 2011.
[Editor’s Note: Of course it’s not perfect, it’s also particularly skewed in neighborhoods with a lot of renovations, say Noe for instance, where investment drives the metric, along with the Median Sales Price, up.
Speaking of which, what percentage of the San Francisco Market does D5 represent? That would be less than 20 percent, the fixer segment of which is even smaller. And once again, “give or take depending upon the neighborhood.”]
You’re right silly me going off on a tangent about the fixer/developed house market in nice D5 on a thread about a developed fixer in nice D5. What in the world was I thinking.
True. Roughly 2% inflation between july 2010 and june 2011.
Not that it really matters for this specific property. It wasn’t a very good investment.
The same money would have been better invested into a couple of leveraged properties in the 94114. With the 30% bounce we saw (zillow index = 961K for 4/2011, 1.25 in 3/2013), you could have more than doubled your money in less 2 years in many kinds of scenarios.
Hindsight is always 20/20.
The dude who “flipped” this place always wanted a presidio haights mansion with northern view, but they compromised on this one instead and then ~yr later they found their dream home for probably 2x.
Methink they could care less about this “investment”, actually they’re probably investing other people’s money and clipping coupons.
Good for them