According to the December 2010 S&P/Case-Shiller Home Price Index, single-family home prices in the San Francisco MSA fell 1.0% from November ’10 to December ’10, down 37.8% from a peak in May 2006 and down a nominal 0.4% on a year-over-year (YOY) basis, a steady slide from the 18.3% gain reported this past May and the first recorded YOY decline since October 2009.
For the broader 10-City composite (CSXR), home values fell 0.9% from November to December, down 30.9% from a June 2006 peak as values fell 1.2% year-over-year.
“We ended 2010 with a weak report. The National Index is down 4.1% from the fourth quarter of 2009 and 18 of 20 cities are down over the last 12 months. Both monthly Composites and the National Index are moving closer to their 2009 troughs. The National Index is within a percentage point of the low it set in the first quarter of 2009. Despite improvements in the overall economy, housing continues to drift lower and weaker.” says David M. Blitzer, Chairman of the Index Committee at Standard & Poor’s.
“Unlike the 2006 to 2009 period when all cities saw prices move together, we see some differing stories around the country. California is doing better with gains from their low points in Los Angeles, San Diego and San Francisco. At the other end is the Sun Belt – Las Vegas, Miami, Phoenix and Tampa. All four made new lows in December. Also seeing renewed weakness are some cities that were among the last to reach their peaks including Atlanta, Charlotte, Portland OR and Seattle, where news lows were also seen. Dallas, which peaked late, has so far stayed above its low marked in February 2009.”
For the fifth time in five months prices fell on a month-over-month basis across all three price tiers for San Francisco MSA single-family homes. And for the second time in two months, home values fell on a year-over-year basis for San Francisco’s top two price tiers.
The bottom third (under $336,356 at the time of acquisition) fell 2.2% from November to December (down 2.3% YOY); the middle third fell 1.3% from November to December (down 3.1% YOY); and the top third (over $616,298 at the time of acquisition) fell 0.9% from November to December, down 1.2% on a year-over-year basis.
According to the Index, single-family home values for the bottom third of the market in the San Francisco MSA have fallen back to July 2000 levels having fallen 58% from a peak in August 2006, the middle third is back to May 2002 levels having fallen 38% from a peak in May 2006, and the top third has retreated back below February 2004 levels having fallen 25% from a peak in August 2007.
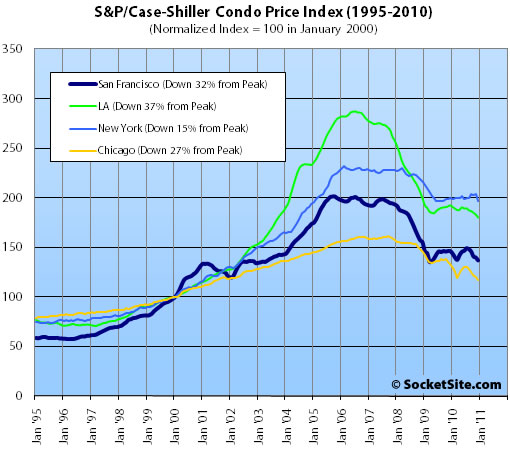
Condo values in the San Francisco MSA fell 2.1% from November ’10 to December ’10 for a 6.5% drop in value year-over-year (down 32.1% from December 2005).
Our standard SocketSite S&P/Case-Shiller footnote: The S&P/Case-Shiller home price indices include San Francisco, San Mateo, Marin, Contra Costa, and Alameda in the “San Francisco” index (i.e., greater MSA) and are imperfect in factoring out changes in property values due to improvements versus appreciation (although they try their best).
∙ Case-Shiller: National Home Prices Are Close to the 2009Q1 Trough [Standard & Poor’s]
∙ S&P: San Francisco Home Values Fell Across The Board In November [SocketSite]
∙ May Case-Shiller: San Francisco Tiers Up But Gains Moderating Atop [SocketSite]
OK. And the other way to look at this is that the index is still up over 10% from it’s bottom in April of ’09, and prices are flat to where they were at the end of 2009. I’m much more concerned with major milestones than small monthly movements. As best as I can see, the peak was in spring ’06 whereas the bottom was in spring ’09.
@Lance … while you may be correct that the bottom was spring of 09 for the greater SF MSA, you should keep in mind the home buyer tax credits, various mortgage adjust programs, and other government intervention that was designed to create a floor for price. As these programs began to end during the spring and summer of 2010 you see prices begin to decline again.
On a side note … Watching Economists from the S&P (including Mr Shiller) on CNBC this morning, they were not very optimistic about home prices in the near term and signaled more declines are likely.
But hopefully were are almost done burning off the excess home supply and soon new construction can start contributing to GDP and help the economy really take off.
smells like a double dip……
This is all about the SMSA, including East and South Bay.
For City of SF, what are the numbers and do they think in 2011 the, say, 650,000-850,000 houses and condos will be flat, going up or down?
Those are the steepest downward slopes since 1991! Consistent, too!
What could it mean?
What does it mean? It’s a double black and we should be skiing this mofo. Ski the steeps, where does it level off?
@ tipster: I’m not flaming here, but which slope are you referring to? The recent slope isn’t nearly as deep as the one before things bottomed out in Spring of ’09. In fact, I don’t see much of a slope at all since then….that’s the point.
After having spent the past year trying to explain why the 20% “gain” was illusory you might want to tone down the exclamation points.
Ignoring things that go against your preconception and celebrating anything that confirms them is not a path to clearly seeing the world as it is.
The greatest enemy of the scientist is himself and his own desire to see what he wants to see in the data. Thus the scientific method is primarily about devising ways to answer questions in which the scientist’s preconceptions can’t influence the answer he gets.
CS is just as good and just as flawed when it’s giving an answer you like as when it’s not.
^ is this some kind of a riddle? I don’t get your point.
sorry, that was directed at tipster
well said diemos
tipster’s perma bear comments seem limitless.
hibernate like all bears (satchel, myself, toehrs) when its obvious that winter has arrived – don’t clam its summer when it isn’t.
that said, the trend for ‘real SF’ home prices is going to be nominally downward to sideways for another few years. In real terms they will be dropping well over 10% in the next 5-7 years. Prices here are much sitckier, but they too will adjust.
Give it a decade.
@diemos, an oven thermometer that consistently reads too high can still be used to indicate when things are cooling off, no?
@lance, sorry, my bad. I meant steepest January slope.
Meanwhile not a single listing or transaction in my neighborhood under $1M so far this year. Nice houses listed for $1.5M sell in days … meanwhile I paid $850k last year.
I mean, the data shown above LOOKS bad and all but I don’t see the decline happening in my local ‘hood. Who really cares what happens in Fremont or Vallejo?
^Ha ha, that’s what people said in 2008, too.
Yeah but ’07-’08 wasn’t a period of supposedly catastrophic economic decline (yet). Things didn’t really come unglued in a way that would impact any average buyer until September ’08.
Contrast that to ’10-’11 … its been doom and gloom for close to 3 years now. Prices are still strong and sales are brisk. Explain.
Explain: everyone knew prices were higher than incomes could justify, and no one thought the government would step in with all sorts of foreclosure moratoria and tax breaks.
And now, prices are higher than incomes, and it’s clear the government is no longer willing to step in with foreclosure moratoria and tax breaks.
So the slope heads down again.
Ride that baby down, JNLB! Whee! It’s fun!
@tipster – what is your prediction for the SF (proper) market, if not bouncing along a shallow bottom? Are you suggesting Japan style declines? Or another steep drop as the budget is being “balanced” and government interventions are scaled down?
The markets that have been supported by benevolent lending practices for several years isn’t going to correct in a matter of a few years. As pointed out “watching a paint dry of grass growing” this is going to take time. There are several headwinds that will continue to pound the housing market, in fact a few comments from Mr. Shiller:
Mr. Shiller, noting the unrest in the Middle East, a large backlog of foreclosed houses, the uncertain future of the mortgage holding companies Fannie Mae and Freddie Mac, and proposals to reduce the mortgage tax deduction, saw “a substantial risk” of declines of “15 percent, 20 percent, 25 percent.”
Buy now or be priced out forever. Bwahahaha
A few months ago Shiller said he could see slight gains in the upcoming years. He’s just one Yale economist at the end of the day. A bunch of Harvard economists put out a markedly more optimistic forecast around the same time.
@badlydrawn bear — Re: Economists
“Mr. Case said he thought the housing market was at “a rocky bottom with a down trend.” That made him the optimistic one.
Mr. Shiller, noting the unrest in the Middle East, a large backlog of foreclosed houses, the uncertain future of the mortgage holding companies Fannie Mae and Freddie Mac, and proposals to reduce the mortgage tax deduction, saw “a substantial risk” of declines of “15 percent, 20 percent, 25 percent.”
The 20-city composite is currently off 31.2 percent from its peak. Many economists expect the market to fall another 5 to 10 percent in the next few months.
One data point that favored Mr. Case’s optimism: The adjusted declines in December and November were about half the drops in the previous two months, indicating the slide may be slowing its velocity.”
http://www.nytimes.com/2011/02/23/business/economy/23housing.html
I really don’t give much weight to seasonally adjusted data in turbulent times and even S&P warned that it’s seasonal adjustment was suspect.
The 0.9% MoM decline of the top tier is about 10% on an annualized basis which is a significant down trend. Though data can be noisy an one shouldn’t assume that prices *will* go down 10% this year. This would seem to give pause to people thinking of putting 10% down into a house.
Unlike Lance, I see the top-tier index at 143.52 which is just 7.8% over the March 09 low of 133.13
CR had an interesting chart recently showing equity distribution by state:
http://cr4re.com/charts/charts.html?Delinquency#category=Delinquency&chart=CoreLogicNegQ3Fig4.jpg
1/4 of California’s have less then 5% equity (so would probably need to bring cash to close to cover transaction costs) The chart doesn’t have the granularity to show what a 10% decline + 5% transaction costs would do, but by eyeballing the -5 -25% bracket it would seem to bring close to 1/2 of all california into the cash to close bucket.
Also, the CR post that contained the above chart had a tidbit about the time from default to losing the house in a judicial state like FL (unlike the common case in CA).
“That process now takes an average of 25 months in South Florida, according to Lender Processing Services, a Jacksonville-based mortgage firm.
It takes nearly 15 months of delinquency before the foreclosure process even begins. Then foreclosure cases linger in courts for an average of 10 months, often much longer if the homeowner has a lawyer.”
http://www.miamiherald.com/2011/02/19/2076031_p3/the-curse-of-negative-home-equity.html
The CS indices are back to trending in the right direction – DOWN. I’ll guess 100-110 on both of the SF MSA indices b4 we’re done. A few more years – maybe as few as 2…
tc_sf,
1/4 of California’s have less then 5% equity
I think you misread the graph. For CA, it’s roughly 35% with less than 5% equity, and 31% with no or straight negative equity.
Absolutely incredible chart. NV is 2/3 under water. AZ is 1/2. Michigan which did not benefit that much from the housing boom is even worse than CA.
Social consequences of this are huge.
– If you lose your job: good luck if you have to move out
– If you depended on your house as a retirement asset and see it underwater, well, you’re out of luck. I hope you have good joints. You’ll need them when you’re in your 70s.
– If you used the house as a cushion for potential accidents (medical, job loss)…
Housing was the poor man’s wealth building medium. It was there mostly to make up for the past 25 years’ worth of government disinvestment in traditional social engineering. Well, that didn’t work.
@lol — Quite right. I was reading off the wrong bar.
Mr. Case says: the slide may be slowing its velocity.
The previous month to month drops (SF Index) were absolute disasters. I’m going to agree with Mr. Case; the 1.0% month to month drop is putting us in closer proximity to the Nov.-Dec drops of 1991 (0.92%) and 1992 (0.93%). My guess (at this point) is that the SF Index will be able to eek out weak seasonal gains; it won’t turn positive until April, at the earliest. New lows for 2012.
“Mr. Case says: the slide may be slowing its velocity.”
I don’t see this very strongly in the SF top-tier unadjusted data.
For the last half, I see MoM of
Jun-Jul -0.40%
Jul-Aug -0.51%
Aug-Sept -0.05%
Sept-Oct -1.27%
Oct-Nov -0.70%
Nov-Dec -0.88%
Jimmy (No Longer Bitter) wrote:
> Meanwhile not a single listing or transaction
> in my neighborhood under $1M so far this year.
> Nice houses listed for $1.5M sell in days
>… meanwhile I paid $850k last year.
Are you saying that your neighborhood is up ~75% in a year (if you sell your home in a few days at $1.5mm you will get a 76%+ return)?
> I mean, the data shown above LOOKS bad and
> all but I don’t see the decline happening in
> my local ‘hood.
We are still renting in Presidio Heights, but we are thinking about moving back to the Peninsula (a decent place in Burlingame or Menlo Park or a fixer in Woodside or Hillsborough) and if we found a place we liked for $850K today we would buy it (and not care if it went down in value over the next few years).
I’m not going to be like tipster and say that values are going to drop another 50%, but I’m also not going to say that prices are up 75% from last year.
> Who really cares what happens in Fremont
> or Vallejo?
The lenders (including Fannie and Freddie) do and if they lose money in on Northern California real estate loans it will be harder (and/or more expensive) for anyone (even someone that wants to buy a bay view home in Pacific Heights) to get a home loan…
@FAB: you will never find anything in Woodside or Hillsborough, in any condition, for $850k. Not ever. Nice dream, tho!
Jimmy-
Never say never…. or even “Not ever.”
Or perhaps the apocalypse has occurred and escaped our notice.
$699k 3/2 1,970 sqft
35 Sequoia Way
Woodside, CA
Price Reduced since November
http://www.redfin.com/CA/Woodside/35-Sequoia-Way-94062/home/897579
That place is practically in La Honda. “Real” Woodside is waaaaayyyy down a steep hill from there.
as one of the 07 bears on this site, I am starting to become a little less bearish, but am still a little bearish. As a renter, In 07, my projection was to purchase a 2bd/2ba property in D7. my timelines was to make the purchase by Summer 2010 as i thought that would be near the bottom. The market has taken longer to fall than i had expected, and while looking seriously at some units in 2010, with climbing inventory and decreasing demand, the time still did not seem right. My price range is $750-900K. I can promise you that in 07 and 08 and 09, there was very very little in that price range in the area. but in 2010 and now, there are quite a few places that are worthy to look at and consider seriously. My assessment is that 2bd 2ba condo market in prime D7 has shifted from about$1.1M in 2007 to $850K now (or about 30%). During my wait, I have accumulated the cash for a 30% downpayment, but really feel like now I will most likely wait until Fall (Oct/Nov) 2011 to really buy-in. I am still paying $2150 for a 1250Sqft 2bd 2ba on Sacramento and Buchanan with parking.
i know that I am going to risk and probably lose by buying before the market has bottomed out and the rent vs. buy equation is still way out of whack, but i am finally going to do it.
This house is way way up in the hills. 84 & Skyline. Not a bad place to hide from the FBI… 85 year old log cabin that the listing says NEEDs WORK in bold. Probably a tear down – rebuild project. Saw smaller although similar cabin in Hillsborough a little while ago for $720k. A realistic place to live will cost a lot more in the 94010 – at least at this time.
FAB was asking for a fixer and Jimmy’s response was fairly unequivocal
” you will never find anything in Woodside or Hillsborough, in any condition, for $850k. Not ever. ”
The place is only 16 min from Bucks according to Google. It takes longer then that to get to downtown SF from a number of neighborhoods.
But closer to downtown, this place went for $945k for a 3/2 last April
http://www.redfin.com/CA/Woodside/307-Hillside-Dr-94062/home/894130
Just 11% over his target. Case Shiller is down ~3% since then. While not a given, 8-9 months of the current annualized decline would bring it right there. This would hardly be an apocalyptic outcome.
Nobody has denied that SF and the Bay Area in general are still pretty expensive. What is being argued is by how much we have come down and how much is left before any meaningful rebound can happen.
The key is that there’s still a bit of cash on the sidelines. Many of my friends have squirreled away enough for a good downpayment for a few years now, but didn’t want to blow it by competing with blind credit (2003-2007) or blind money (2006-2008). Now hat things are settling down, value is starting to show up.
Great time to shop for the next 2-3 years. Inflation will start to pick up but the shadow inventory and strict lending rules will create a lagging effect on prices, imho. This will rebalance the buy-vs-rent ratio and make buying a good bet as long as you’re not into a bidding war or any other emotional purchase, that is…
“The key is that there’s still a bit of cash on the sidelines.”
You’re obviously referring to people contemplating a rent to own transition which is it’s own category. But the plight of move up buyers is one reason I look at the proportion of people with zero or less equity after transaction costs as surplus equity from a previous house would be a typical source of DP cash for a move up buyer.
Which is also why a 1%/month rate of decline is troubling were it to be sustained, since even with a 10% DP buyers would have effective negative equity in about half a year.
What catches my eye is that the January 11 index is exactly where the January 91 index was! And that was already down from the 89 peak. Even if the chart is in constant dollars (which I assume it is), that doesn’t say much for Bay Area real estate as an investment over 20 years…
Jimmy (No Longer Bitter) wrote:
> @FAB: you will never find anything in
> Woodside or Hillsborough, in any condition,
> for $850k. Not ever. Nice dream, tho!
You are the one that said you bought a home you liked for $850K and I just said that if we found a home we liked at the same price we would do the same thing today (I’m not planning to write an offer before I go to bed).
I would like to spend less than $1.5mm, but my wife keeps looking at homes closer to $2.5mm. Her parent’s home in Portola Valley was probably worth $7.5mm in 2007 and is still worth close to $5mm, but her older brother paid $1.8mm for his little place in West Menlo so it should not be hard to find a place nicer than his for $$1.5mm today.
@ exackerly — You may be looking at the YoY percent change chart rather then the actual index value (which is not back to ’91 levels). Case Shiller reports (and SS presumably graphs) in nominal dollars.
CR usually does a national chart in real dollars adjusted using CPI less shelter.
http://cr4re.com/charts/charts.html?Home-Prices#category=Home-Prices&chart=RealHousePricesDec2010.jpg
Someone on the web has probably done this for the SF data, or you can grab the raw data from S&P and use Excel.
OK, but I bought a nice place in San Mateo for $850k. Big difference between San Mateo and Hillsborough. Hillsborough is, like, 1/4 mile west of here, for starters. Totally, total0.ly different market.
$1.5M in Hillsborough might, theoretically, be possible. Provided you don’t mind the noise from 280.
I am NewBuyer, I am the most important real estate expert on this blog. When I speak, people listen. You will now quake before me, as I reveal the truth.
And here is the truth…
The San Francisco market has indeed seen sharp declines in the last two years. And those sharp declines have been largely concentrated in two areas of the market:
1) Super-luxury homes that once priced at $1,000 – $1,200 per squarefoot. With very little exception, the market cannot sustain these premiums. And many homes that used to command four-figures per squarefoot are now moving closer to $800.
This decline is impacting even the most venerable neighborhoods, such as Russian Hill and Pac Heights. It is decimating new, luxury condos.
But those — like me — who bought starter homes in Russian Hill for closer to $600/sqft have seen only small declines. This is not wishful thinking. This is the word of NewBuyer!
2) Homes in “up and coming” neighborhoods like Hayes Valley, Potrero Hill, and Duboce have taken a real beating in the last two years. They were never worth what the buyers paid in the first place.
And thus spoketh NewBuyer. And the people trembled and groveled before him as his words dissipated and rose to their gilded home beyond the spheres.
You’re obviously referring to people contemplating a rent to own transition which is it’s own category. But the plight of move up buyers is one reason I look at the proportion of people with zero or less equity after transaction costs as surplus equity from a previous house would be a typical source of DP cash for a move up buyer.
In a city of more than 60% renters, the rent-to-own move has as much importance than move-up.
Also think of the transformation in the population. Lots of new people, many in tech, that came here in the past 15 years. Many were renting. Many have started families since. Many have bought or are considering buying.
For instance many of my friends came at about the same time in SF: 1997 to 2005. All have had 6 figure jobs for a while now, renting and socking away a few 10s of 1000s a year. All have stock options or straight stock from GOOG, ORCL, NFLX, ADBE, AAPL, most from early in the game.
There are many like these out there. And they’re all eager to buy one day or another. Now that they’re into their 30s, it’s likely it will be sooner rather than later.
Jimmy (No Longer Bitter wrote:
> OK, but I bought a nice place in San Mateo
> for $850k. Big difference between San Mateo
> and Hillsborough. Hillsborough is, like, 1/4
> mile west of here…
I guess you missed some of my older posts where I’ve said that my family moved to Hillsborough in 1968 when I was a little kid and from 1969-1985 my parents bought a bunch of rental homes and apartments in Burlingame and San Mateo (My parents still live in the same house and have never sold a rental property) so I know that Hillsborough is West of San Mateo…
FAB,
Do you have any Grey Poupon?
@lol — I mentioned the move-up as I had just posted the equity distribution chart, which as I mentioned gives some insight into the cash available for move-up buyers.
Regarding rent to own buyers,
SF does have a high fraction of renters, but keep in mind that the median household income for renters in SF is $54k per the 2009 ACS census. So half of the renting households in SF make less then $54k. That half is probably unable to make a rent to own transition for a market rate house given current prices and lending conditions.
The following is more conjecture, but I also know a number people in the tech industry and my impression is that many of them have already bought. In the lending climate of the past years anyone with a tech income could easily buy a house if they so chose. Choosing not to buy seemed the exception not the rule, though I would guess that slightly more people in tech considered housing a bubble at the time then in the general population. If I consider second homes and investment properties I would guess that homes outnumber people among those I know. (Although the second homes and investments would more likely then not be out of the SF area, i.e Tahoe)
tc_sf,
Yeah, but Median doesn’t even start to describe the actual purchasing power of renters. If you have 3 renters: 10K, 10K, 50K, the median will say 10K.
There’s a mass of rent-controlled entitled renters, but also many renters who pay recent market price and can afford/have some incentive to buy.
Out of my 20-or-so old dot-com buddies, maybe 6 or 7 have bought their home. Some have bought twice already. But still many renters… That doesn’t make a market, because most are foreign-born, but you get my drift.
And Tahoe has burned a couple of people these last 2 years. I have heard of a few incredible deals though too late to pounce.
I’m not sure what you’re getting at in your example with the median. In your example, the median is 10k and 2/3 of the renters make 10k or less, which is how the median should be interpreted. (Though with something like income with five significant digits you wouldn’t expect the corner case of identical data points you illustrate)
Barring numerous identical data points the median indicates that half of households make that amount or less. If your point is that by itself the median tells you nothing about the upper half, then you are correct. But you can find income distribution for SF not broken out by housing tenure and make some reasonable assumptions.
“That doesn’t make a market, because most are foreign-born, but you get my drift.”
This would generally be the most common reason tech people I know who are renting didn’t buy. They never intended to stay in the BA long term and were always planning to return home.
I would also concur that the second home in Tahoe plan didn’t seem to work out as intended for many people.
The median comment shows that you can have a very low median while the upper crust of salaries can be extremely better off and in high numbers. The SF market is made at the margins, with a pretty low turnaround due to overly generous entitlements (prop 13 + excessive renter protection including the Ellis Act SF poison pill), and mostly by people in this “hidden slice” who are not represented in the median.
Please read “turnover” instead of “turnaround”
@ spencer:
i know that I am going to risk and probably lose by buying before the market has bottomed out and the rent vs. buy equation is still way out of whack, but i am finally going to do it.
Would you mind sharing why you want you want to buy inspite of the logical conclusions that you’ve drawn that now may not be the best time to buy? The analysis on this blog tend to delve into the cold, hard numbers. We almost never get to hear the other, human side of the equation.
On another note, that’s an interesting neighborhood your curently living in. Can you tell me how you managed to find a 2bd, 2ba with parking for only $2150? Thanks.
VancouverJones,
The secret to cheap rent is timing. Take a time machine, go back to Year 1997 and lock in a good price. Rent control will do the rest. While you’re at it, please buy some AAPL shares for me.
lol,
No problem on the AAPL shares; just let me know how many you need. I’ll even request paper copies and put them in a safe deposit box for you (I just have to be careful as to which bank I choose). 🙂
VancouverJones,
I got the deposit box already figured out. In it you’ll find some MSFT stock from 1986 that I got from a 1962 IBM play. Please put it all on those AAPL.
Making an offer on a Broadway house as we speak.
Please come back safely.
Warren.
Just found the AAPL stock. Thanks. You still have to do the trip, VancouverJones.
Re pent up supply,
Fannie/Freddie/FHA REO inventory hit another record high.
http://cr4re.com/charts/charts.html?Delinquency#category=Delinquency&chart=REOinventoryQ42010.jpg