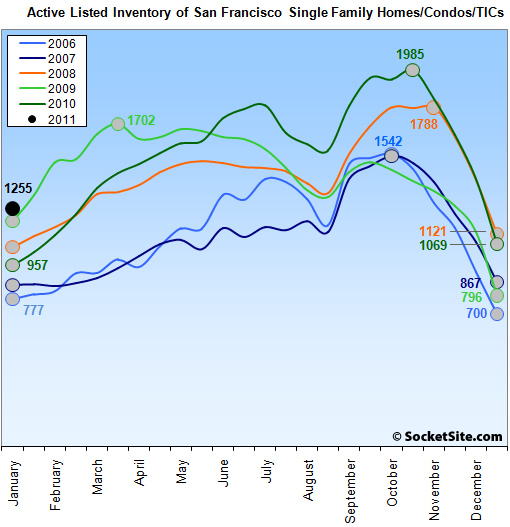
The model we’ve used to track listed housing inventory over the past five years suggested we’d see a 17.4 percent increase in listed San Francisco inventory over the past two weeks. The actual change? Up 17.4 percent to 1,255 units and up 31.1 percent on a year-over-year basis (up 61.5 percent versus 2006) for a six-year start of the year high.
At the same time, listed sales this past December appear to have been just over 400, down a few percentage points from 2009.
Keep in mind that January inventory increases tend to be driven by listings that were withdrawn from the market in November and December and are now returning to the market “anew.” Expect inventory levels to continue to climb over the next four months.
The inventory of listed single-family homes for sale in San Francisco (527) is currently up 46 percent on a year-over-year basis while listed condo inventory (728) is up 22 percent.
The percentage of active listings that are either already bank owned (101) or seeking a short sale (212) has ticked down to 25 percent but is up 8 percent on an absolute basis. And while the percentage of all active listings in San Francisco that have “officially” undergone at least one price reduction according to the MLS has dipped from forty-three to thirty-nine, said drop is being driven in large part by new listings for returning properties.
The standard SocketSite Listed Inventory footnote: Keep in mind that our listed inventory count does not include listings in any stage of contract (even those which are simply contingent) nor does it include listings for multi-family properties (unless the units are individually listed).
∙ Listed San Francisco Housing Inventory End Of Year (2010) Wrap-Up [SocketSite]
Just curious if anyone has monthly SF inventory data for a wider window than 6 years? Say 10 or 20 years?
Just curious if anyone has monthly SF inventory data for a wider window than 6 years?
Be very careful in comparing different reports as most others include contingent sales.
That being said, while we don’t have as detailed a breakdown for past years, based on our numbers inventory in San Francisco was tracking about 30 percent higher in September versus 2004, the earliest year for which we have any real confidence in the numbers.
Ah, black again. Good call.
So we’re starting 2011, the low point of the cycle other than the brief year-end holiday season, not far from the high point of the bubble years. With 25% of listings in distress. Low sales volume will keep prices falling. High distress levels will further that trend as will interest rates creeping higher.
1,800 by March?
Correct me if I am wrong, but aren’t there more units every year. All the new buildings have added hundreds/thousand of new units? And you get 200 new condo units every year from the conversion (figure takes away 60 buildings so net 140). Not saying this accounts for the higher number of listings but I know you all love apples so I had to point out we may be looking at an orange.
@peanut — Looking at inventory as a percent of total units has some value. Akin to an apartment vacancy rate.
Comparing inventory to sales, i.e. months of inventory, is also commonly used to give some insight into the relative bargaining position of buyers vs sellers.
Speaking of months of inventory, it was very low for December this year, since so many listings were yanked with sales still somewhat strong. December appears usually as a trough, but it was a pretty deep trough this time around:
Columns are: MLS inventory as reported by SocketSite closest to mid-month, MLS sales as reported by rereport.com, months of inventory, and trailing 3 months of inventory:
Dec-10 1408 404 3.5 4.8
Nov-10 1834 326 5.6 5.4
Oct-10 1936 372 5.2 5.0
Sep-10 1797 341 5.3 4.8
Aug-10 1594 360 4.4 4.3
Jul-10 1799 385 4.7 3.9
Jun-10 1697 446 3.8 3.9
May-10 1599 480 3.3 3.8
Apr-10 1491 317 4.7 4.2
Mar-10 1361 414 3.3 3.9
Feb-10 1116 247 4.5 3.8
Jan-10 909.5 226 4.0 3.4
Dec-09 1131 412 2.7 3.2
Nov-09 1346 395 3.4 3.5
Oct-09 1460 435 3.4 3.3
Sep-09 1448 392 3.7 3.3
Aug-09 1352 495 2.7 3.5
Jul-09 1569 452 3.5 4.3
Jun-09 1630 389 4.2 5.1
May-09 1685 328 5.1 6.0
Apr-09 1622 277 5.9 6.9
Mar-09 1648 238 6.9 7.7
Feb-09 1500 192 7.8 7.2
Jan-09 1189 141 8.4 7.1
Dec-08 1405 265 5.3 5.8
Nov-08 1788 241 7.4 5.6
Oct-08 1789 381 4.7 4.3
Sep-08 1544 332 4.7 3.8
Aug-08 1388 393 3.5 3.4
Jul-08 1470 478 3.1 3.2
Jun-08 1496 426 3.5 3.4
May-08 1491 478 3.1 3.6
Apr-08 1381 382 3.6 3.9
Mar-08 1329 318 4.2 4.3
Feb-08 1159 292 4.0 4.0
Jan-08 1053 215 4.9 3.8
Dec-07 1077 355 3.0 3.3
Nov-07 1393 408 3.4 3.6
Oct-07 1532 452 3.4 3.3
Sep-07 1408 346 4.1 3.0
Aug-07 1187 464 2.6 2.4
Jul-07 1157 470 2.5 2.3
You “interest rates are going to do this/ effect that” guys are tired. Rates have gone down since last fall when you were saying the exact same things.
^wachoo talkin’ about, Willis?
I get rate sheets mailed to me weekly, dude. Rates are down since December’s five straight weeks of climbing: http://www.dsnews.com/articles/mortgage-interest-rates-ease-further-this-week-2011-01-13
Tipster, a word to the wise. You’re too greedy of a grave dancer. You don’t have to do the Pee Wee Herman in the mausoleum, bruh. Just feel the groove. (And I bet you really, really suck at poker, but I digress.) You should be enjoying the market’s shift despite the fact that it’s much slighter than you want or predicted. Instead you want to talk as if it’s calamity and to prognosticate bleakly about every little maybe.
“Rates have gone down since last fall when you were saying the exact same things.”
Let’s look at the bankrate data linked in the article you referenced:
http://www.bankrate.com/finance/mortgages/mortgages-stall-on-mixed-economic-news.aspx?ic_id=tsThumb1
Rates leaped in the Fall and have since trickled down a teensy, insignificant bit. I don’t think there is any serious debate over who is doing more spinning here.
Pent up supply is slightly down over the past couple of weeks. Currently, 1574 homes are in some state of foreclosure (NODs, NOTS, bank owned) in Ess Eff. This is compared to 1604 homes two weeks ago. Standard disclosures about noise in the data; information deemed reliable but not guaranteed.
The issue isn’t even what rates have done since someone made the prediction. Everyone who knows anything about rates knows that they have to go up at some point. 30-year fixed mortgage rates are largely based on the 10-year T-Bill plus a margin. Does anyone think the 10-year T-Bill’s rate won’t go up at some point?
The Fed and Treasury have worked to keep the margin lower than it should be, but does anyone think they will be able to make the margin a negative number when rates go up?
Again with the spinning thing from you. It is what it is. There’s up. There’s down. You agreed. And let’s remember your accomplice was talking calamity.
Not sure who my accomplice is in this scenario, but it’s simply laughable when the “overpaid” King of Spin flujanonn the realtormon blames someone else for spinning. Do you or do you not think that prices might go up if interest rates go up? Do you or do you not think interest rates will go up at some point? Answer the question or shut up, man — as it is now, you’re just throwing dirt to throw dirt without adding substance.
Sellers: slash your prices before your neighbors do.
Sell now or be priced in forever.
“does anyone think they will be able to make the margin a negative number when rates go up?”
Exactly. The Fed is monetizing another $1/2 Trillion in new Treasury debt and the 10 year is still rising! Anyone who thinks interest rates aren’t going up simply don’t understand economics.
When POMO ends, rates will likely jump 100 basis points in under six months.
I call it like I see it, and I say when I think people overpay concurrently all the time on this site. I don’t say over the top false things on here for fun. You, Tipster and AT are joined at the hip any more. Why? They make you look terrible.
Note that Fannie/Freddie are scheduled to increase fee’s for some higher LTV loans on April 1
https://www.efanniemae.com/sf/refmaterials/llpa/pdf/llpamatrix.pdf (Tables 2 & 4)
Note that I believe that the percentages quoted are one-time fees, not interest rate modifiers. For low LTV and high credit score loans the effect may be small, but It seems almost certain that these increases will be passed on to the consumer
I don’t think it is quite that simple to say that residential real estate prices are going to drop if mortgage rates inch up, which I think most believe they will in the coming months. IMO real estate investors (not home owners) are more sensitive to increasing interest rates, especially the rates on treasuries, as they have a more pronounced short term affect on the returns one is seeking. Yes, rising mortgage rates effect the potential pool of homeowners that can purchase a specific property, but increasing interest rates also affect the overall economy in terms of supply and demand for capital, how/where capital flows, and required rates of return on capital, and hence, real estate values in a variety of ways. We have had large percentage increases in home values in the past during periods when mortgage rates were quite high including during 1976-1980 (30 YFRM 10-13%), 1987-1989 (9-11%) and 1997-1999 (7-9%). Bottom line, it is not a simple linear equation.
On another note, here is some data I just received. This is just SFR and Condo sales and is pulled from MLS so does not include new condos and I excluded TIC/multi units:
– 4245 total sales in SF 2010 with SFR sales back to just about 2007 levels and condo sales up 17% YOY, but still 14% below 2007 volumes
– $2M+ sales up 38% YOY to 178 transactions
– 724 or 17% of all sales listed as distressed sales (DS=REO or short sale)
– 271 (37%) of DS totals in D10 (Bayview/Hunters)
– 162 (22%) of DS totals in D9 (SOMA, to be expected with all the new condo tower projects IMO)
– 87 (12%) of DS totals in “Real SF” (D5/7/8, a lower number than I expected)
– Total of 585 sales in D10 so 46% of sales were DS
– Compared with 1,244 sales in D5/7/8 or 7% of sales were DS
– Median distressed sale price averaged over all of 2010 was $300k less than non-distress (to be expected for multiple reasons)
I (and many others) have seen a softening of market since mid-2010. However, as pointed out by others above, it is difficult to really analyze this graph without having more historical context (yes, we were at height of the biggest RE bubble of our times in 2006/2007) and numbers going back to more “normal” times as well as a percentage listing of total units in SF would tell a much more complete story. This is why the industry tends to use the Month’s Supply of Inventory (UC calculation) to estimate current supply and demand effects, and which by the way, stands at under 3 months right now with the 24 month running average at about 3.6 months. I expect this to jump up in January with many December expired listings hitting the market. Pricing held relatively stable (medians and $/sf) in 2010. We’ll see what 2011 has in store for us.
Hmm, I though it was fairly un-disputed that higher real (inflation adjusted) interest rates all other factors being equal would push housing prices lower.
Higher interest rates cause both an increase in financing costs and in increase in opportunity cost for the down payment amount. Additionally if you are cash flow negative, as many properties featured on this site are, the higher rate more heavily penalizes for current losses.
If you’re looking at a house today with rates at 5%, went to sleep and the next day inflation was the same, growth the same, but interest rates were 6% I can’t see why you’d be able or willing to pay more for the same house.
What complicates the issue is that some times (like in the 70-80’s) inflation can be quite high so nominal rates can be high without real rates being high.
Also, interest rates can be correlated with economic growth. Low rates with low expected growth and higher rates with higher growth. Higher growth is good for housing prices, but it is the growth expectation that causes both the rise in prices and rates, not the rates causing a rise in prices.
Additionally, there is the issue of treasury rates vs mortgage rates. If the spread goes up this favors buyers with more cash since the increased rates are born disproportionally by buyers who finance.
My impression was that the negative sensitivity of housing prices to interest rates was one of the primary reasons that the fed is trying so hard to keep rates low.
If it really doesn’t matter (or has a positive effect) then they are spending a whole lot of money for nothing!
LOL!
“I call it like I see it”
Posted by: fluj/anonn/anon.ed at January 18, 2011
“Scare tactics are dead. San Francisco never really took a price hit and it won’t , either.”
Posted by: fluj/anonn/anon.ed at June 23, 2008
Poor eyesight/foresight and zero credibility as far as I am concerned fluj/anonn/anon.ed.
Skirunman,
High prices have been mainly caused by low rates and loose lending policies.
On one side, lending policies have tightened a bit both on the qualifying criteria and the range of products (Ninja/NegAm deadbeats no-more). That was the first leg down.
Now, if you think the slaying of the other evil twin would have no impact, you are deluding yourself. I bought a place in the mid-90s and sold it 10 years later. I made a 200% profit mainly because of the cheap rates. The person who got it in 2006 had a rate almost half what mine was originally for, and her mortgage payment was less than my original outlay, adjusted for inflation.
Now you could tell me she would have paid that amount in 2006 anyways just because of this or that. But I know how much she makes and she couldn’t have afforded it at my 1995 rate. She would have bought cheaper, or not bought at all. I would have gotten less demand and therefore would have lowered my asking.
If you think the rate-vs-price elevator works only one way, well, good luck. The other leg down has been stopped at great expense but it could have happened.
I anything, all this government meddling has made me bullish. The US Govt is creating cheap debt and the whole wide world is still crazy for it, obviously. And that should keep rates relatively low.
Now overall I see prices still pressured down. But locally this is a different story. Subprime areas/cities will not perform well in the future, I think. Affluent people want more city and less cheap suburb. SF is in the best position in the country to offer quality of life and rich city life.
@tc_sf: “I though it was fairly un-disputed that higher real (inflation adjusted) interest rates all other factors being equal would push housing prices lower.” Nothing is undisputed in this world! In this context to what degree will housing prices change and will all other factors really stay equal. IMO once rates start to rise then many other relevant things do change in our economy that effect housing prices. I did not say there would be no effect, but that it is not a simple model of interest rates rise x% and housing prices drop y%.
Also, I don’t think your comment “if you are cash flow negative” ever comes in to play when purchasing a primary home to live in. Cash flow is a concern for real estate investors purchasing in the rental market sector. Most of the discussion regarding RE pricing on SS is with regards to primary homes, not investment properties.
IMO this is a very naive statement “If you’re looking at a house today with rates at 5%, went to sleep and the next day inflation was the same, growth the same, but interest rates were 6% I can’t see why you’d be able or willing to pay more for the same house.” It is quite simple, if I want to buy house X and so does Mr. Y, and I have the down payment, credit score, and income to quality for the 6% loan then I will buy house X at a price higher than Mr. Y is willing to pay. There will likely be a smaller pool of potential Mr. Y’s to complete with, but frankly the fact that interest rates are 5% or 6% may be in the “noise” of my overall financial outlays. If rates rise so much that the effective pool of potential buyers is reduced greatly than certainly the laws of supply and demand come in to play, but IMO there is some elasticity here. There are many non-investment related reasons we purchase the homes we live in.
“My impression was that the negative sensitivity of housing prices to interest rates was one of the primary reasons that the fed is trying so hard to keep rates low.” I’m no macroeconomist nor am I big fan of the fed’s current monetary policies or Mr. Bernanke in general, but I don’t believe that to be their primary stated reason. From what I have read it is to “rev up the economy” and to “help reduce unemployment”. I have my own opinions on what I believe are their real reasons are for keeping rates so low and continuing to devalue the dollar, but it is not really relevant to this discussion. The fed is not really spending money, they are printing it…
In a low inflationary environment, you can only have home prices rise if the nation’s productivity rises. In the late 70s’ women entered the workforce and in the late 80s, personal computers became cheap enough and easy enough to operate that productivity went way up. When women entered the workforce, households had nearly twice as much money as they did before,so inflation went rampant and people expected their salaries would go up 20% every year. It’s actually hard to keep housing prices down in that environment because everyone’s household income just doubled, and they were expecting it to double again every 4 years.
That isn’t happening presently. In fact the reverse is happening: with high unemployment and high underemployment,the country is not very productive. As a result, even low interest rates can occur yet prices can still fall, like they are doing now.
As for skirunman’s usual statistical BS, he goes back for the entire year so that he can capture the benefits of the anomaly of the tax credits that cause lots of people to buy, so he can say it’s just like 2007.
But the last recent couple of months had sales down hard YOY. I don’t know where he gets condo sales up YOY. They were down about 40% in Nov YOY and they are down 32% in Dec. I guess down 32% means up 17% in the magical world of statistics of skirunman.
By the way, this is why the NAR tries to hold on to the stats so closely: if the recent stats are unfavorable,they just go back as far as they need to until the stats are rosy, which they always are in NAR land. Skirunman uses this technique a lot.
Click on the condo tab and scroll down to the stats. See for yourself the “up 17% YOY”. The only thing that is up YOY is inventory. Sales are down hard YOY.
http://www.redfin.com/city/17151/CA/San-Francisco
I did love the comment about how “low” distressed sales in D7 are. One in 8 is low? I hope you are surprised for many years.
“if I want to buy house X and so does Mr. Y, and I have the down payment, credit score, and income to quality for the 6% loan then I will buy house X at a price higher than Mr. Y is willing to pay.”
Most people stretch to buy the nicest home they can afford. They are already stretched at 5% interest. When interest rates go up to 6%, the amount they will qualify for is less. So Mr X and Mr Y can want whatever, but Mr.Bank will tell them where they need to stop because the bank won’t give them another dime. Money doesn’t grow on trees.
Not everyone is in this boat, but the majority are and the minority knows it. The minority knows they merely need to bid $1 more than the competition and they can see from the comps that the target is falling every time interest rates rise. Any one who doesn’t get this, will learn this lesson very harshly when they try to sell.
@lol: No one is disputing, or even discussing, that “High prices have been mainly caused by low rates and loose lending policies.”
I also did not say there would be no effect on RE values with rising interest rates, but that it is not a simple model. RE values are a function of basic supply and demand with demand being effected by mortgage rates as only one of the many inputs.
One other thing to consider is the inputs effecting supply. When potential sellers have locked in low mortgage rates they have less motivation to sell when mortgage rates begin to rise, which can lower supply leading to upwards pricing pressures that can offset some of the demand decrease.
In your personal situation who is to say that a much better qualified person would not have come along the day after you accepted the offer from the women that was stretching to buy your place. In any case, it does not matter, but I do agree with you that demand is likely to stay high in desirable urban areas like SF.
I’ll finish by saying that in my own personal experience interest rates were never high on my list of factors when purchasing my personal home. I have owned RE in Bay Area since 1988 so have seen quite a bit of rate fluctuations over that time.
@tipster: You are always there for a good laugh, thanks, I needed one right now.
You seem to think I come up with some assertion and then present some data to try to support that assertion. Nothing could be farther from reality as I am a very rational person in general. I get data from multiple sources, including lots of RE brokers, and as I have said before, they would likely be more than happy to provide you data if you asked nicely. I then analyze it and make my assertions on what I believe the data is saying. I certainly can come to wrong conclusions from the data, but I don’t manufacture data.
Yes, you caught me. I presented data for an entire year to “capture the benefits of the anomaly of the tax credits” or maybe it was because it is a new year and people like to summarize the last year’s results to compare them to previous years. Boy am I sneaky…
I don’t have December YoY data handy, but I will try to get it. I did post Nov YoY volumes in another thread, but here they are again:
SFR: 2009 – 206 units, 2010 – 172 units, down 17%, Oct 2010 was 199 units and Dec 2009 was 204.
Condo: 2009 – 193 units, 2010 – 134 units, down 31%, Oct 2010 was 162 units and Dec 2009 was 178.
Yes, I am a magician!
“I did love the comment about how “low” distressed sales in D7 (sic) are. One in 8 is low? I hope you are surprised for many years.” Thanks, it is D5/D7/D8, and it was lower than I expected, especially when you consider these two facts. First, distressed sales in D9/D10 were at 30% of all sales. Secondly, I did a quick review, admittedly very unscientific, of apples presented on SS over the last 90 days and I found 68 apples presented of which 24 were distressed sales. Only one from my recollection was in D10 so if we eliminate this sample we are at about 33% distressed rate in apples presented. One would expect the rate to be closer to the 10%-15% range if the apples were truly representative of the entire market (mean is 12% of all sales were distressed sales in SF excluding D10 in 2010). I expected more distressed sales based on what I read on SS.
“Most people stretch to buy the nicest home they can afford.” I don’t know this to be fact as in my personal experience it is not something I do. However, I will defer to your ultimate wisdom here.
“They are already stretched at 5% interest. When interest rates go up to 6%, the amount they will qualify for is less. So Mr X (it was house X, not Mr. X, at least get the players right if you are going to reuse my story!) and Mr Y can want whatever, but Mr.Bank will tell them where they need to stop because the bank won’t give them another dime.”
Yes, but now Ms. W and Mr. Z, who were interested in buying property A, but no longer can afford it, yet who do qualify for property X, will be trying to buy property X. The seller does not necessarily have a reason to reduce the price as it is just a different set of buyers now wanting to buy the property.
Of course this little story is a bit trite, but you can get the picture. Yes, smaller qualified pools of buyers will ultimately reduce demand, but the reality is not as simple as you try to make it out to be.
Hmm, I though it was fairly un-disputed that higher real (inflation adjusted) interest rates all other factors being equal would push housing prices lower.
as you yourself expanded on, and others chimed in, the problem is that in the real world the other factors don’t remain equal.
I prefer to simplify aggregate house buying ability (perhaps erroneously) to this:
aggregate house buying ability is mainly dependent on savings, income, and credit.
house prices can go up if buyers have higher savings, higher income, or more access to credit. house prices will suffer if the reverse occurs.
Let’s step back for a second.
Over the last several decades median and average savings have plummeted in the United States. At one point in the mid 2000’s it neared (and maybe hit? I forget) NEGATIVE! Less savings is obviously a negative for housing prices. (it fuels the downpayment!)
as we all know, median and aggregate households have NOT kept up with inflation for quite some time as well. I disagree with someone above’s use of the word “productivity”. Productivity is skyrocketing right now, however due to US tax policy and trade/corporate laws those productivity gains do not go to the workers. Almost all of it goes to the owners of capital and/or financial entities.
Thus, for the vast majority of people in America, their income continues to fall on a real basis, even with productivity gains.
This reduced aggregate income (ex hyper wealthy) is also negative for housing.
Falling savings and falling incomes were replaced by insane increase in credit from 1998 through 2007. The housing bubble was not a housing bubble. It was a credit bubble. Credit was expanded (using NINJA loans and fraud) to unbelievable extents. The Fed of course encouraged and fueled this bubble with low real interest rates.
That credit bubble took a major hit in 2007-8 bringing on the obvious Great Recession and housing collapse.
so where are we now:
-Aggregate savings continue to do poorly for all but the very wealthy. As cost of goods continues to increase and unemployment continues there is no reason to expect Americans to have more savings with which to purchase a house any time soon.
-Aggregate income continues to do poorly as well, again for all but the very wealthy. As global wage arbitrage and tax policy continues to attack all but the hyper-wealthy, again encouraged by our Govt and Fed, there is no reason to assume that median or average income will improve for any except the Welfare Goddesses (TBTF bankers and others with carte blanche to the White house), and maybe a few other uber wealthy individuals.
The trend for many years has been that nearly 100% of productivity gains and even 100% of growth goes to the financiers and owners of capital, not the workers.
I see nothing that would indicate change here
===
so if income isn’t going to go up for all but a few, and savings won’t go up for all but a few, where will the money come for housing?
Simple: The CREDIT side. the Govt/fed are trying to reblow a bubble in housing. It’s been obvious since the get go, and I said as much before the recession even began. The problem: it is difficult to direct the bubble. You can throw the money out there, but it can bleed into other areas.
In our case, we are seeing an echo bubble in the stock market and the commodity market. (Again, as I predicted years ago). It will be very hard to reblow a bubble in housing because it depends on so many players to believe the story… it also depends on the little people, but they’ve been screwed over again and again, and the Fed couldn’t care less about them. Thus, housing will be hard to reflate.
But stocks and commodities. Gosh, that can be done with just a few players… and even better it’s players who literally have lunch with Ben Bernanke and Tim Geithner! Perfect! Thus, the money “intended” for housing goes into stocks and commodities.
This of course puts pressure on the little people. But who cares? They are little. We only care about Jamie Dimon and Bill Gross.
So our current policy supports the TBTF zombies and encourages rampant speculation in stocks and commodities which will further depress disposible income for the masses. (negative for housing).
once the zombies are totally bloated again, then they can extend credit to the plebes.
hopefully that happens before real interest rates get pushed up.
thus, there is still no reason to expect any significant RE gains any time soon.
As for SF itself:
I can see that the true PRIME SF areas will do fine, since they are bought by the Welfare Goddesses with their hands held out to mama govt, or they are bought by the TRULY wealthy. That would be places like Pacific Heights.
Probably not places like Noe though. I have always and still maintain that Noe is more of an “aspirational prime” nabe made up of high income earners as opposed to a place of true wealth.
Certainly not places like SoMa or Bernal or whatever.
in the end,IN MY OPINION SF is a high income city but most of the residents are not wealthy . there are of course a VERY small percentage of extremely wealthy people. They do well no matter what. (tax policy and laws again, which will only get better for the rich as we turn increasingly to neoliberal economics).
so we see the continued Brazilification of America. Perhaps SF can some day be as awesome as one of the only cities that is truly more beautiful than SF… Rio. amazing properties right on the water, and then Favelas just down the street.
[anon.ed] wrote (but forgot to add a few things):
> I call it like I see it…
and I always say it is a good time to buy (so I can make money)…
> and I say when I think people overpay
Evey time a property sells for less the people paid they “overpaid” because it is always a good time to buy and real estate always goes up (unless you overpay)…
> concurrently all the time on this site.
> I don’t say over the top false things
> on here for fun.
I do it so people will tink that it is a great time to buy and I will make a living selling them real estate…
“> I call it like I see it…
and I always say it is a good time to buy (so I can make money)…
> and I say when I think people overpay
Evey time a property sells for less the people paid they “overpaid” because it is always a good time to buy and real estate always goes up (unless you overpay)…
> concurrently all the time on this site.
> I don’t say over the top false things
> on here for fun.
I do it so people will tink that it is a great time to buy and I will make a living selling them real estate…
”
Somehow that’s worthwhile? Typing that sort of nonsense?
Who can afford a 3000 mortgage? Most couples I know. But I work in the tech industry.
This market is very imbalanced:
Supply is constrained by both rent control/renter protection and proposition 13. Very few properties are for sale as a result (who in his right mind would give up a 800/month rent or 1K/Y property bill), which means the market is still mostly made at the high end of the salary spectrum. Let me explain.
Say you have 80% of the population making less than 150K, but many of these 80% are in a cushy situation like retirees or long-term government employees (cheap rent or prop-13 subsidized housing) then the market is mostly done by the wealthier 20% and this greatly skews numbers.
The median income in SF is around 90K. In any normal place in the US this would translate into home values in the mid-300s. Because the market is messed up by reckless entitlement, this translates into home prices 500K and up.
This also means that the protected segment of society will fight even more to keep their entitlements, messing up this market permanently.
@ Michael, yeah that was a time when I deviated a bit from “call it like you see it.” Because prior to that I was always saying, “a change is likely but it isn’t here yet.” That time turned out to be a little over the top because I’ll admit, I was annoyed. In hindsight it looks funny. But in the context of the “blood in the streets” people I was arguing with? Not too bad a prediction. There are thousands of ridiculous quotes you could grab from those folks that look really insane. If you were so inclined …
ex-sfer,
good analysis as usual except that i think you underestimate how much money people in sf have.
i also think that the current tax policies benefit alot more people than the ‘uber wealthy’.
as to tippy’s assertion that people always stretch to buy the most house they can, i call bs.
granted, he knows four friends going thru bankruptcy right now and i don’t know any so i guess he runs with a different crowd…
good analysis as usual except that i think you underestimate how much money people in sf have.
Perhaps.
I still stand by my claim due to many things including:
-census bureau income demographic information for SF
and
-the negative effect the credit freeze had on SF RE, and the obvious positive effect the “jumbo conforming” and Fannie/Freddie/FHA changes had on SF.
and
-the debated effect of the First time homebuyer credit (and its discontinuation) had on SF sales.
and
-the change in mix of loan types for SF home purchases from 1995 through present. An overwhelming reliance on Option and IO ARMs.
clearly SFers rely on credit regardless of their salary and savings.
but I agree it is possible I underestimate SFer wealth, and cannot prove this point definitively.
i also think that the current tax policies benefit a lot more people than the ‘uber wealthy’.
crumbs to the masses.
hordes to the rich.
how much disposable income will the typical $50k/year or $100k/year salaried employee get from the extension of the tax cuts?
how about those making $1M or $5M/year?
who takes home lots of money in capital gains (taxed at 15%)?
who owns the majority of stocks in America? (sure many people own stocks, but only a few own substantive amounts).
who owns the majority of assets in America?
how about the Estate tax changes? (yes yes, I know, all those “farmers” are saved… hahahaha)
it is OBVIOUS who is benefiting from tax policy and law changes in America over the last few decades.
All one needs to do is look at the share of assets that the top 0.1%, 1%, 5%, and 10% control historically.
the charts are striking.
that was the whole reason for the credit bubble in the first place… to try to continue “growth” by borrowing demand from the future, with a nice side effect of masking the problem of ever increasing wealth disparity in America and elsewhere.
the masses didn’t mind so long as they could buy a house, a car, an ipod, and a boat on credit.
now it’s falling apart. and where does the govt/fed focus its efforts?
on the banks.
hmmm…..
Tipster has it right, but not as to all buyers. It is certainly true that a substantial percentage of SF buyers do, and did, buy the absolute most expensive place that someone is willing to finance. That is why sales volume in SF crashed when the no-down no-doc loans ended. The number of “qualified” buyers plummeted. Those in this category will certainly see their purchasing power decline as rates and downpayment requirements go up, and they will be priced out at a lower level.
But it is also true that there are a decent number of SF buyers who can actually afford to pay high prices. But the rub is that those in this group tend not to be stupid. They are not going to pay $2mm for a home where there is a “just as good” place available for $1.5mm or if they expect that $2mm home will soon be worth much less. For about 15 years, until 2009, the CW was that every place was likely to go up in value regardless of the price paid. This was not unlike the dot-com years when we all knew the prices on these tech stocks was way out of line but they sold anyway solely on the expectation that the pyramid would grow a little more. But now the CW is that home prices will fall (or at best stay flat) and that better deals come from waiting. Every buyer out there has the option of simply not buying, and this is also dampening demand.
While many sellers have the option of not selling, a substantial and growing number do not – REOs and short sales and over-extended “owners.” Add up all this and we have high supply, low demand, and declining prices. All sellers have to compete for this dwindling pool of buyers by lowering prices.
i think you fellows are missing the forest for the trees. if even a crappy place next to caltrain is asking $700k+ as a foreclosure you can see how different prices are in sf compared to the nation as a whole.
i totally agree with ex-sfers comments about who benenfits but i think you are missing a huge and vital segment of the population-those making $150-500k/year in the bay area. with that kind of income you are in the top 10% nationally. and despite what you read here most folks who make that kind of income do save, do buy financial assets and do benefit from low cap gains and estate tax poloicies. don’t forget the irc 121 which gave us $500k tax free gains to roll into the next property.
interesting point skirunman makes too about selection bias on ss. 60% of distressed sales
are in the very marginal areas, and only 12% in real sf-yet we see so many of those featured here.
and then you guys all jump on anon.ed for being partisan…
“Also, interest rates can be correlated with economic growth. Low rates with low expected growth and higher rates with higher growth. Higher growth is good for housing prices, but it is the growth expectation that causes both the rise in prices and rates, not the rates causing a rise in prices.”
Certainly, interest rates can be correlated with economic growth, and that’s when housing prices have gone up, as you said. Growth is one component of interest rates and that component has a different effect on housing prices. What I’m saying is that there will be a component of interest rates that will go up solely because 10-year T-Bills go up. The result due to this component alone will be that prices must drop to account for decreased purchasing power. This is an entirely uncontroversial opinion except on SocketSite.
“60% of distressed sales
are in the very marginal areas, and only 12% in real sf-yet we see so many of those featured here.”
Editorial feeds opinion and opinion feeds editorial. I wasn’t around for the early days of SocketSite where people said things like “where my bubble peoples @,” but when I look at the archives on occasion, I see plenty of people saying the housing bust will never hit the shrinking “real SF” and that foreclosures will never affect real SF. Guess what, they did, so there is now editorial about it in response to all the bubble deniers of the past.
Furthermore, best I can tell, SocketSite has always emphasized housing porn more than housing in poor neighborhoods. Things are no different now. If there is housing porn that is under foreclosure, of course it’s going to be featured here.
What’s Moving Interest Rates?
Short answer is “improving economic prospect”.
The points about ss apple selection bias are odd. Of course ss is going to generally ignore D9 and D10 apples showing substantial declines. Even the bullest bulls gave up long ago arguing that prices there had held up. Featuring those easy-pickins would just invite criticism that D9 and D10 have obviously cratered but what about “real SF”? So ss focuses on “real SF” apples. Gee, those also show substantial declines, although not (yet) at D9 or D10 percentages.
And there has long been an open invitation for all these positive apples in any SF district that will “prove” the ss market picture has been distorted by selection bias. Nobody ever seems to come up with any.
[Editor’s Note: That’s a bingo.]
Skirunman sez “I’ll finish by saying that in my own personal experience interest rates were never high on my list of factors when purchasing my personal home. I have owned RE in Bay Area since 1988 so have seen quite a bit of rate fluctuations over that time.”
That matches my experience almost exactly. But a salient point is that I’d expect that both Skirunman and myself are quite fiscally conservative. I never expected to let my loan run the entire course of 30 years and paid down the principle aggressively in the initial years. In addition I had strategies to liquidate other assets to stem interest payments if my rate rose (it was capped at 12%) So though the interest rate was a factor the total home sales price was far more important.
The problem with extrapolating from the opinion of a fiscally conservative homeowner is that it is a minority opinion. The majority was mainly focused on their monthly payment. During my futile search for a new home during the boom I qualified for a loan twice the amount that I was comfortable with. It would have been easy to outbid the competition on any single home.
anonee/paco sez : “as to tippy’s assertion that people always stretch to buy the most house they can, i call bs.”
Technically true since there was a minority of conservative buyers out there. But the minority doesn’t drive the market. In a multiple bid situation, what do you think the odds are that at least one other bidder was pushing their credit limit to the unsustainable max ? I’m thinking something like 99%.
In today’s lending market the amount that one qualifies for is a lot closer to the amount that they can actually repay.
“In a multiple bid situation, what do you think the odds are that at least one other bidder was pushing their credit limit to the unsustainable max ? I’m thinking something like 99%.”
i get it, none of the savvy ss bears overreached but everyone else did.
Well, we’re in the world of anecdote here, but interest rates were certainly a key factor when we bought our place in 2000. We qualified for a loan that was about 60% higher than we ultimately paid, so it is true that interest rates did not weigh much on the “cap” we would/could pay. But it took a lot of talking my wife into buying as her mindset was that under rent control renting is always smarter in SF. In making the rent vs. buy calculations to convince her buying made more sense for us, interest rates were a key component of the pretty decent spreadsheet I worked up in determining the payments, lost investment income, and tax deductions so we could be comfortable that we were coming out ahead by buying. Higher rates certainly would have pushed the “buy” side of the equation higher and may have resulted in a different result — e.g. deciding not to buy.
“i get it, none of the savvy ss bears overreached but everyone else did.”
Sorry I wasn’t clear but what I meant was all it took was one bidder to overreach in a multiple bid situation (which effectively was every home I bid on). And multiple agents including my own buyer’s agent alluded to the notion that the only way to win in that market was to overreach.
Are you implying that unsustainable/risky bids were not the norm during the boom ?
Nobody ever seems to come up with any
People do every single time. Even the ed. does, occasionally. Like that Bay street property a couple days ago. This little refrain of yours only shows that you don’t pay any attention and only like to talk.
As to apples and selection bias, there’s this. Is the bearish readership entertained by the apples the editor chooses? Of course it is. Data an apple might be. But it was selected for a number of reasons, and entertainment value on a for profit website shouldn’t be overlooked.
What’s odd is how some of you get mad when the stories get fleshed out. A smallish house on a subpar 26th street blcok had a record overbid, taking it into a $psqft mark that had never been seen before, or since. How is that not interesting? Why does that bother you? It’s all part of it.
“Are you implying that unsustainable/risky bids were not the norm during the boom ?”
Well since we’re being extra picky here, let me refine and rephrase that :
Are you implying that sales attracting unsustainable/risky bids were not the norm during the boom ?
Regarding “all other things being equal”, I was trying to make a point about correlation vs causality and to look at the effect on one factor at a time. There may be times when housing prices are correlated with interest rates (i.e. they both go up), but the high interest rates are not the cause of the increasing housing prices.
In the real world there are hardly ever two time periods where “all other things” but one factor were equal, but I think it improves clarity to isolate one factor at a time.
While it seems that anything can be disputed, one would think that most people would agree that writing a large check to the IRS is a negative thing. However, many people who write large checks to the IRS have large incomes which is a positive thing. If you misjudge the causality relationship here and write a larger check to the IRS in hopes of getting a larger income you will be sorely disappointed. This is why the Fed does not increase interest rates in order to stimulate the economy even though periods of high economic growth can be correlated with high interest rates.
My crystal ball isn’t good enough to predict what “all other factors” will do in our current situation. But I’m fairly confidant that the Government is expending great effort to keep interest rates below where they would be otherwise. In my mind the key question is how this will end up. Will they be able to keep up the life support until the economy starts to grow on its own? For smaller economies I would tend towards “No”, but the US has the worlds reserve currency, a large economy and a big printing press. So in my opinion it’s hard to say either way.
Regarding cash flow negativity and selling pressure for owner occupiers, this is relevant since being cash flow negative in an owning situation means that downsizing or renting would improve your cash flow situation. In a higher rate environment, this immediate increased cash flow is more valuable since you can invest it at a higher rate. Conversely, a potential capital gain far in the future is discounted more heavily.
Regarding Messieurs X & Y I tend to agree with tipster et al that most buyers are payment limited. Regardless though, If I know that rising interest rates have reduced the buying power of all other bidders it seems that I would just lower my bid rather then downgrade to a different house. The “non-investment” reasons for picking a house would seem to pre-dispose people towards this. Most data I’ve seen regarding median/average income, unearned income as a proxy for wealth, CLTV and % no/low doc loans has not indicated to me that much of SF (Noe, bernal, SOMA, Mission,…) escaped the buying pattern of recent years. For the super rich $10M+ things may indeed be different.
As annon points out $700k for a crappy condo high, but wouldn’t be out of line price-wise for an area like Noe with ~$200k median HH income. But the problem is that you look at Noe and there were $2M homes there and it seems doubtful that the $200k couples were they types living in $700k crappy condos. Price is what you pay, Value is what you get. Pointing to a high price to justify high prices may not be a sustainable strategy.
Regarding house prices and productivity, note that this type of generalization is more applicable to the national market then to a particular regional market. This past bubble was national, but in the past migration patters and the rise and fall of industries ( detroit, silicon valley,…) can have significant local effects. Also note that people’s preferences for larger houses vs other consumption can change over time which can raise median house prices. But as noted the fact that people are building/buying big fancy new houses does not raise the value of your old house in a repeat sales sense. Note also that this can reverse and people can consume fewer sqft/person.
i agree that many folks did silly things and we have heard about them on a daily basis. as anon.ed said, its good entertainment value. does that mean that everyone did this and now everyone will get slaughtered? no.
we all know that the market got crazy and overly competitive. but not all threw caution to the wind, not all overpaid or overstretched. and the salient point is that some properties (good location,light,adjacency etc..)were worth chasing and many were not.
as eddy said, some folks paid $700k for something in the bayview, while others bought smaller in d7 for the same price.
Regarding the theory that when interest rates rise, people will trade down, that almost makes sense, except for the fact that it would require the entire top tier to take their properties off the market because all of their potential buyers would have traded down.
Obviously that won’t happen, so prices fall instead.
With respect to a bit of the bantering about foreclosure stats above: San Francisco Bucks CA Foreclosure Trends, But Not In A Good Way.
as eddy said, some folks paid $700k for something in the bayview, while others bought smaller in d7 for the same price.
Actually, it was for a slightly larger place in LPH, but the concept remains the same.
To underscore my point at 10:13AM, as another example of “SocketSite bias,” $2M+ sales are just over 4% of SF sales according to Skirunman’s numbers (178 out of 4245 sales, although rereport.com’s numbers come out to 4318, I believe). Do you think $2M+ listings are merely 4% of posts on SocketSite? Of course not.
Keep providing those apples, people.
For some perspective on this particular, interesting stat, I see 280 sales at $2+mm in 2007. 178 in 2010. Down by 37%, a much bigger drop than the sales volume as a whole. Not good for those trying to sell in this segment (or any other, but particularly bad for this one).
@AT, good post. I’d like to see the break down of 2 to 2.3 and 1.7 to 2.0 for a better perspective in each year. A lot of the would be 2-2.3’s probably traded below $2M in 2010. My guess is that 1.7 to 2.0M would be net higher in 2010; but that is hard to factor out of the data.
“For some perspective on this particular, interesting stat, I see 280 sales at $2+mm in 2007. 178 in 2010. Down by 37%, a much bigger drop than the sales volume as a whole.”
Yes, the luxury market ($2m+) numbers did drop off a cliff, but market did come back some in 2010, especially in D9. I don’t have the 2007 numbers myself, but let’s assume the 280 is accurate and does not include multi-unit buildings as the number I quoted supposedly did not.
2007 = 280 %ChgYoY
2008 = 197 -29%
2009 = 129 -35%
2010 = 178 +38%, -36% total change
Also, if you compare 2008 to 2010 sales by district that had +2M sales (D1, D4, D5, D7, D8) they pretty much tracked equal percentage drops/gains across all three years with the exception of D7. D7 (Pac Heights) dropped the least and gained the most (76, 73, 91) while D5 (Noe) dropped the most (59, 27, 41). Anyway, not that many data points to make too many conclusions from, but it does seem the traditional luxury market (D7) has recovered better than rest of SF which is to be expected IMO.
We also need to be careful what we are using for the denominator. In the numbers I published earlier I stated my numbers only included SFR and Condos that were reported on MLS and I specifically said I did not include TICs and multi-unit buildings.
2007 SFR+Condo = 4,603
2010 SFR+Condo = 4,245 -8% total change
with SFR up 10% YoY and Condos up 17% YoY.
However, TICs dropped from 709 to 267 -62% and 2-4 units 545 to 390 -28% from 2007 to 2010. If we were to include all transactions on MLS we have a volume drop of 17% from 2007 to 2010 versus 36% in luxury market. The issue being that TICs, and multi-unit buildings to a lesser degree, have cratered much more than more traditional properties because of primarily financing issues IMO.
Also, as pointed out by others, some percentage difference is due to overall drop in market values. Assuming average 15%-20% drop in values from peak and that peak was sometime in 2007, you would expect some of this difference to be accounted for by this fact. I don’t have prior years numbers so no trend analysis, but here is breakdown for 2010 in $1M-$3M ranges:
$1M-$1.25M = 331
$1.25M-$1.5M = 209
$1.5M-$1.75M = 140
$1.75M-$2M = 78
$2M-$2.25M = 48
$2.25M-$2.5M = 33
$2.5M-$2.75M= 21
$2.75M-$3M = 25
@sfrenegade: “Do you think $2M+ listings are merely 4% of posts on SocketSite? Of course not.” and “…best I can tell, SocketSite has always emphasized housing porn…”
I like “porn” apples just like the next guy, but my point continues to be that you can’t take the apples posted on SS and make any definitive conclusions about overall market pricing. The continual postings of the ilk “house X just sold for its 2003 pricing so we are now at 2003 pricing…” are unproven conclusions, and therefore, one must assume they are false, especially as other data tends to contradict.
I hope the Editor continues to post “interesting” apples as I agree that is what makes SS fun to read and there is nothing wrong with it as long as one takes them for what they are, data about that specific transaction(s).
@A.T.: “The points about ss apple selection bias are odd…And there has long been an open invitation for all these positive apples in any SF district that will “prove” the ss market picture has been distorted by selection bias.”
This is a logical fallacy as I have pointed out at least two other times on SS as the responsibility of the “proof” lies with the Editor. It would be simple to post the selection methodology and criteria of the SS apples. It would be much more difficult to “prove” the bias. However, I think we have discussed why it is likely there is bias:
1) We don’t see many apples in D9/10.
2) Apples presented seem to have higher % of distressed sales, at least recently.
3) We see lots of RE porn apples ($2m+ sales).
4) As discussed on other threads there are just not enough apples presented to reach statistically significant conclusions.
Also, as just to clarify, the $2M+ numbers are for SFR only (not condos). The luxury condo market $1.5M+ is up very slightly YoY, but still down 35% from 2008.
@Skirunman — I think the issue is that some people are asserting that the SS apples have a bias towards showing greater losses whereas issues #1 & 3 would seem to go in the opposite direction.
I also don’t see why asking for contradictory evidence is a “logical fallacy”. If people are asserting that the apples presented on SS are far below the actual average, then mathematically there must be some apples out there that are above average.
If some money manager claims to on average make money, and then some evil tipster presents data showing that 10-20% of his holdings are giant losers, even if the tipster has ulterior motives and the selected data is not random, for his claim of positive performance to be true there would have to be some giant winners in his portfolio.
As with points #1,#3 above, if the money manager then reveals even bigger losers to attempt to show that the data the tipster provided was not random, then he may well make that point, but yet do nothing to help his original case.
It is not the asking for contrary evidence that is a logical fallacy, it is that one has to “prove” there is no bias. Instead, to assert there is no bias requires the one making this assertion to provide the proof thereof, i.e. the Editor needs to provide the methodology and criteria to show there is no selection bias. Anyway, I already know the answer so in my mind it is moot.
Also, regarding contrary evidence, contrary evidence has been presented in previous posts multiple times. The issue with apples when you start digging in to them is that any short term apples (let’s say hold times 3 years or less) tend to be either problem properties or distressed sales IMO. I admit to not having statistical evidence to back this assertion up, but I am working on it. However, intuitively I think many would agree with this statement especially as from the data I have seen it looks like SF RE has more like a 10 year average hold time while US in general is more like 7 years.
It seems that people are asserting that the SS apples are biased towards showing larger then average losses. It is certainly possible to assert this and also to claim that the burden of proof lies with showing the apples are un-biased. But it really isn’t a logical fallacy for people to ask for the burden of proof to go with the claim of bias.
As far as contrary evidence, I’ve admittedly only looked into a few, but the few that I’ve looked into haven’t seen very apple like.
See the end of https://socketsite.com/archives/2011/01/no_2006_repeat_for_4381_26th_street_in_2010_and_back_in.html
Where someone implied a +35% apple that wasn’t really an apple.
As far as short term apples being worse properties then non-apples vs being short term apples because of financing/pricing issues (i.e. being currently underwater) of the past few years, I don’t have hard evidence either. But what I’ve been looking at as a proxy for this is the hold times prior to 2000. i.e. If the property itself were at fault I’d expect to see short holds on it during the pre-2000 period. If it had a long hold pre-2000, but then a recent short hold I’d assume more that the short hold was due to the borrower rather then the property. For some of the properties featured here where people dig up the loan data and the borrower quite obviously is stretched and underwater I am even more pre-disposed to blame the borrower rather then the property.
But again, at this point this is more of a case by case analysis then any sort of hard statistical data.
@tc_sf: “It seems that people are asserting that the SS apples are biased towards showing larger then average losses.” Not exactly as this is twisting the original argument. The original argument as supported by some posters on SS is this: “Because some number of apples as posted on SS sold today for $X and they also sold in some prior year Y for just about $X we can therefore conclude that the current SF RE market pricing is also at the level it was during year Y.” One of the premises being that the number and selection criteria of the SS apples accurately represent the state of the market.
However, no proof has been provided to actually show that the SS apples meet this criteria. The logic put forth to support the original conclusion has thus been: “No one has shown that SS apples don’t accurately represent the market (i.e. are biased) so therefore the original conclusion must hold.” This is the logical fallacy Argumentum ad ignorantiam, which is simply assuming something is true because it hasn’t been proven false. The burden of proof is always on the one making the assertion and argument, i.e. that SS apples accurately represent the state of the SF RE market.
skirunman, what “proof” would satisfy you?
I’ve explained the “proof” that would satisfy me regarding your hypothesis that SS apples are biased – present us with some apples going the other way. Fluj always seems to respond, “um, hey man, we did, but I’m just like not going to show you” but nobody else ever provides anything.
He needs at least 5 years of at least 10,000 apples per week. Why are you even bothering? He just wants to shift to a statistic that shows what he wants it to show: median.
That’s his whole point. You’re wasting your time reasoning with him. He’s never going to give up. Apples show a declining market and he doesn’t want people to realize that and bid appropriately. No amount of logic and evidence is going to “convince” him because he has a different motive than accuracy.
@A.T.: “skirunman, what “proof” would satisfy you?”. It should be quite clear as I have stated it numerous times on SS as well as just a couple of posts above this one: “… the Editor needs to provide the methodology and criteria [on how SS apples are selected] to show there is no selection bias.” It would ideally be an accepted random selection methodology.
@tipster: wow, the hyperbole is overwhelming…
Seriously, as was discussed in previous threads, assuming about 400-500 RE transactions per month, one would need to present somewhere around 50 to 150 randomly selected apples. The actual amount would ultimately depend on the accuracy and confidence levels you can accept, but these numbers above cover what would be generally accepted levels for statistical analysis.